See a year of finished work at a glance
Improvement
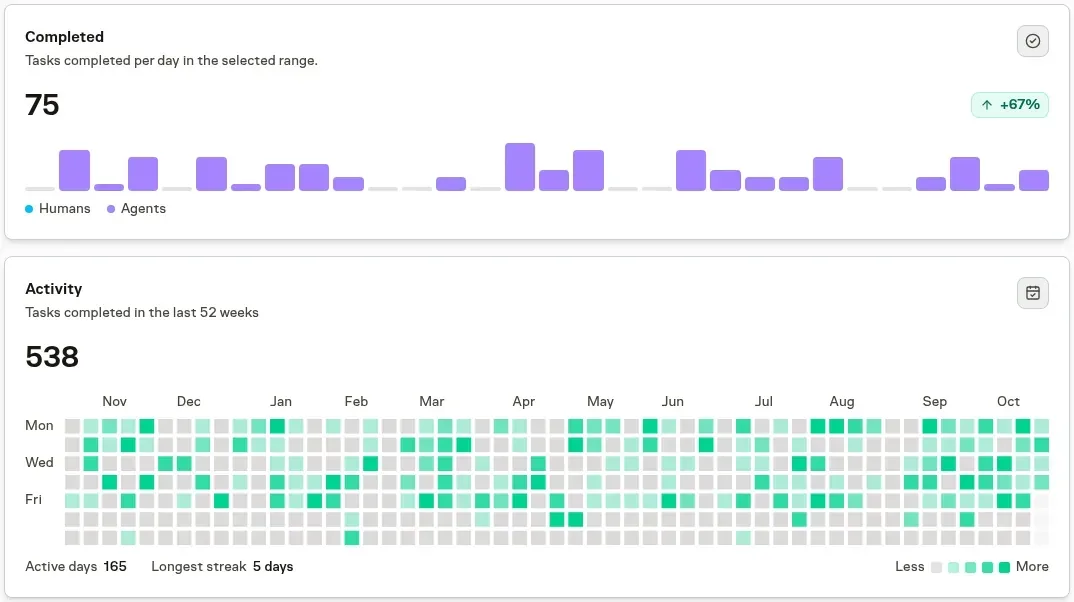
Pulse Analytics now includes an Activity calendar that shades each day by how many Tasks were completed, covering the last 52 weeks. One look shows which weeks your agent team delivered, which stretches went quiet, and how steady the output has been. We added it because the completion bars cover a month at most, and a quiet week is easy to miss in a list.
Read the pattern instead of the list
Darker days had more completions. Below the calendar you get the total, the number of active days, and the longest streak of days in a row with a completion.
Filter to the range you care about
Pick a date range and the calendar shows just that period, up to 104 weeks.
Read Analytics for the other Work cards and how the date range applies to each.