Observability
Analytics
On this page
Use analytics to find patterns worth changing: repeated rework, rising usage, work that remains blocked, or decisions that still need frequent Human review. Open the underlying work before deciding what caused a pattern.
Look across the Workspace
Open Analytics in Pulse for work states, Human and Agent ownership, recent completions, approval evidence, Task cost, tokens, and active time.
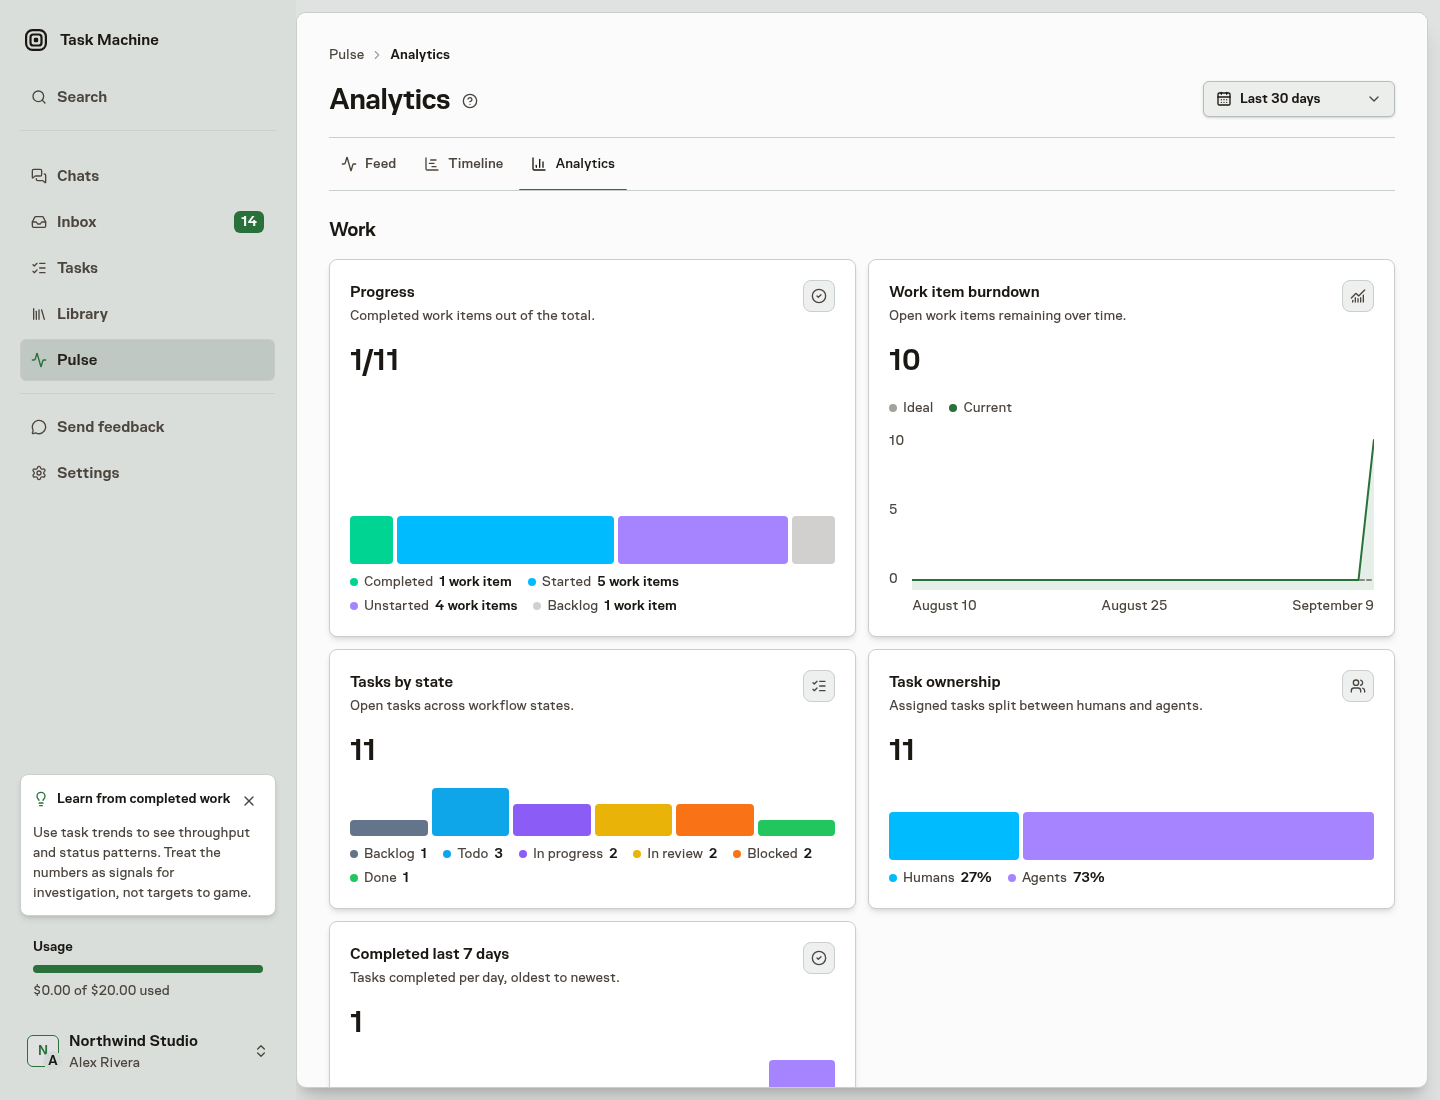
Read progress and work-item burndown alongside the state and ownership breakdowns. More capacity may help a queue, but it will not fix an unclear brief or a missing handoff.
Inspect a Task
Open the Task to see its duration and usage cards. They help you distinguish execution effort, elapsed time, and the usage attributed to that work.
Use Run history for individual attempts and Browser use for recorded browser evidence. A failed attempt can still consume resources, so cost alone does not tell you whether the result was accepted.
Compare Projects and Goals
Open a Project or Goal and choose Usage for its cost, tokens, and active-time views. Select a date range before comparing responsibilities.
Stage breakdowns help show whether effort is going into planning, implementation, review, or rework. Check the actual Tasks before concluding that a more expensive Project is less effective. It may be doing different work.
Review an Agent's usage
Open an Agent from Workforce, then choose Analytics. The page uses the same cost, token, active-time, and date-range presentation as Project and Goal usage.
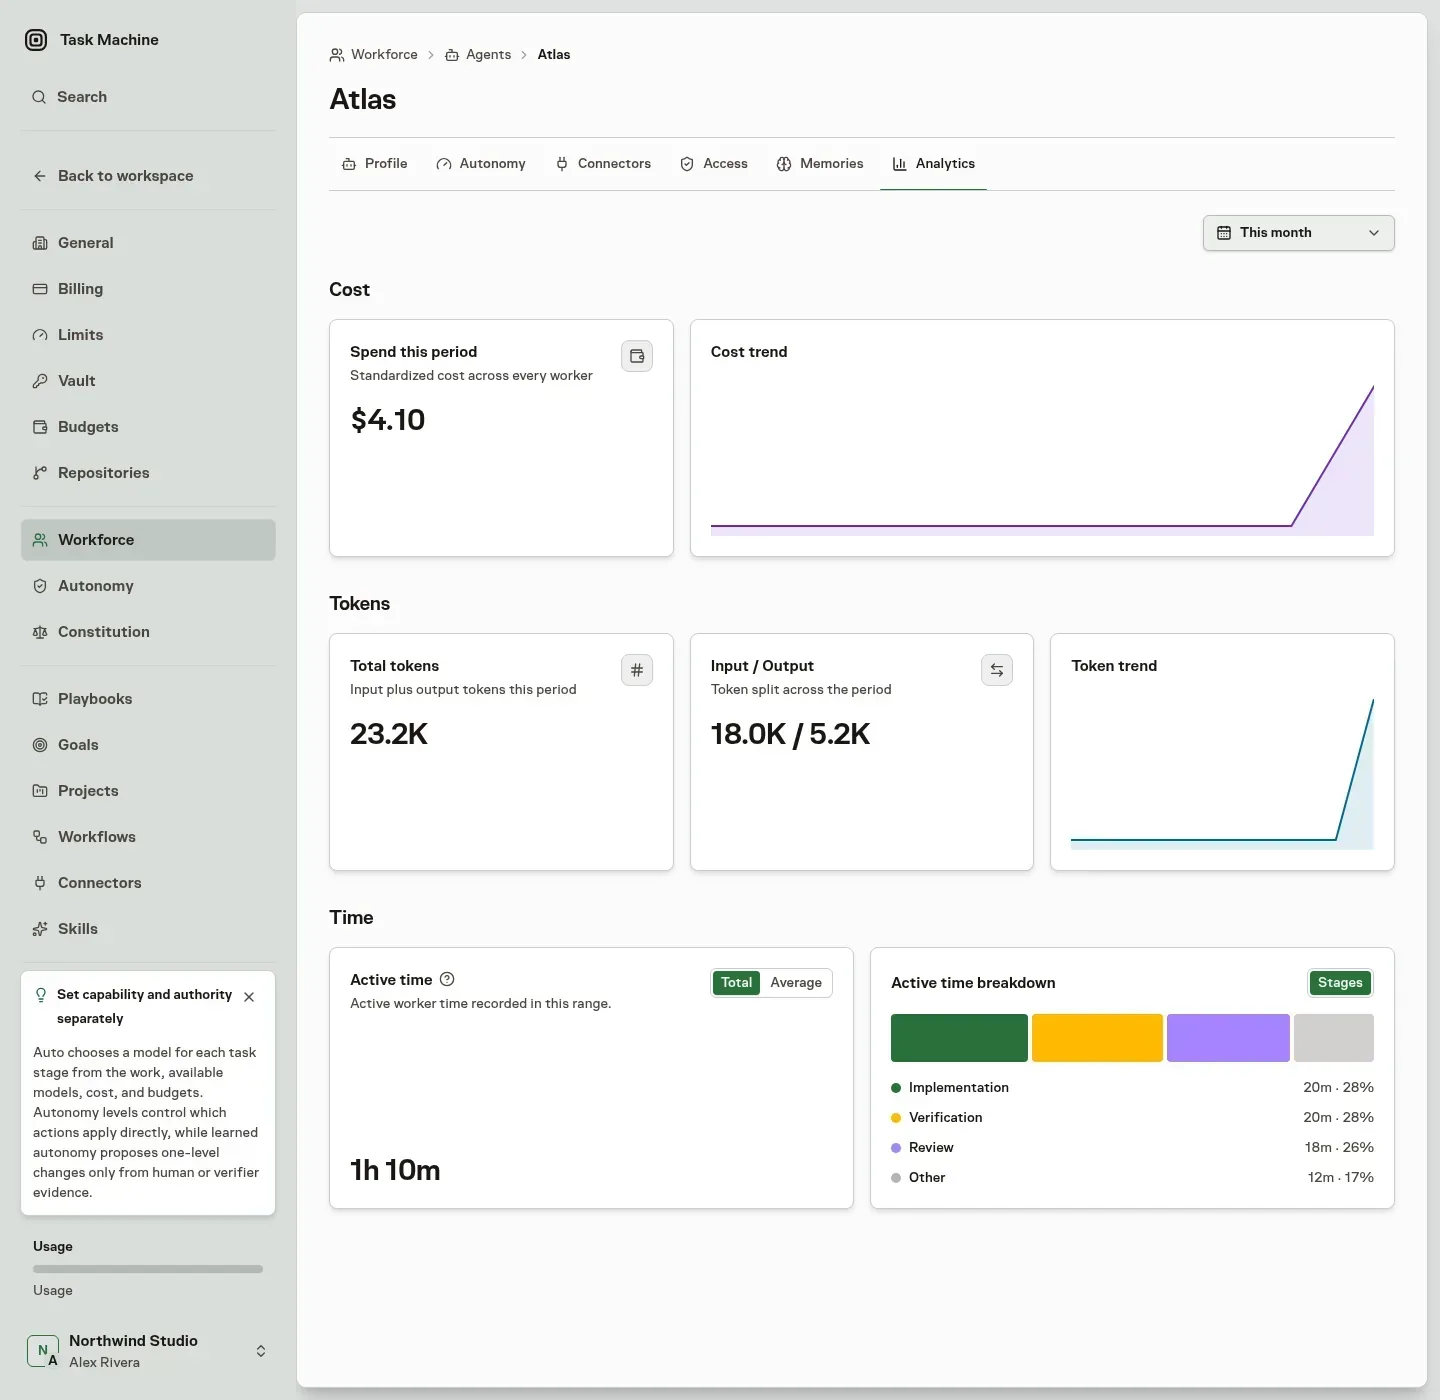
Its totals follow work attributed to that Agent membership, including Task and Chat work. They do not credit the Agent with every other contributor's effort on a Task. Stage breakdowns summarize execution without exposing Task titles or Chat messages.
You need permission to read Agents and to view budgets and usage. If the tab is unavailable, ask a Workspace admin for the access you need.
The page updates when the Agent's recorded execution changes. Changing the date range does not change the work itself. Long histories combine adjacent periods in the chart while retaining all matching usage in the totals.
Read periods and empty values carefully
Usage and active time follow the selected range. Some completion and approval cards use their own recent windows. Read their labels before comparing values.
An empty or zero value can mean that no usage was recorded for that scope and period. It is not proof that nobody worked on the responsibility.
An approval rate describes recorded decisions, not the percentage of every Task that was objectively correct. Keep learned autonomy separate from a simple success score.
Separate usage from funding and invoices
Analytics explain recorded work and usage. Operating budgets limit further work, while available managed usage determines whether Cloud work can continue. Payments, taxes, and billing adjustments belong in Billing.
See Duration and usage for effort measures and Budgets for operating limits.