Dig into task time and usage
The Time and Usage cards now open into dedicated detail modals, giving you a closer look behind their existing totals and stage graphs. We added these breakdowns so investigating a task's delays or costs no longer means piecing together individual agent runs.
Follow the work and the waits
The Time modal brings the task's active and elapsed time together with a timeline of recent agent runs and the waiting between them.
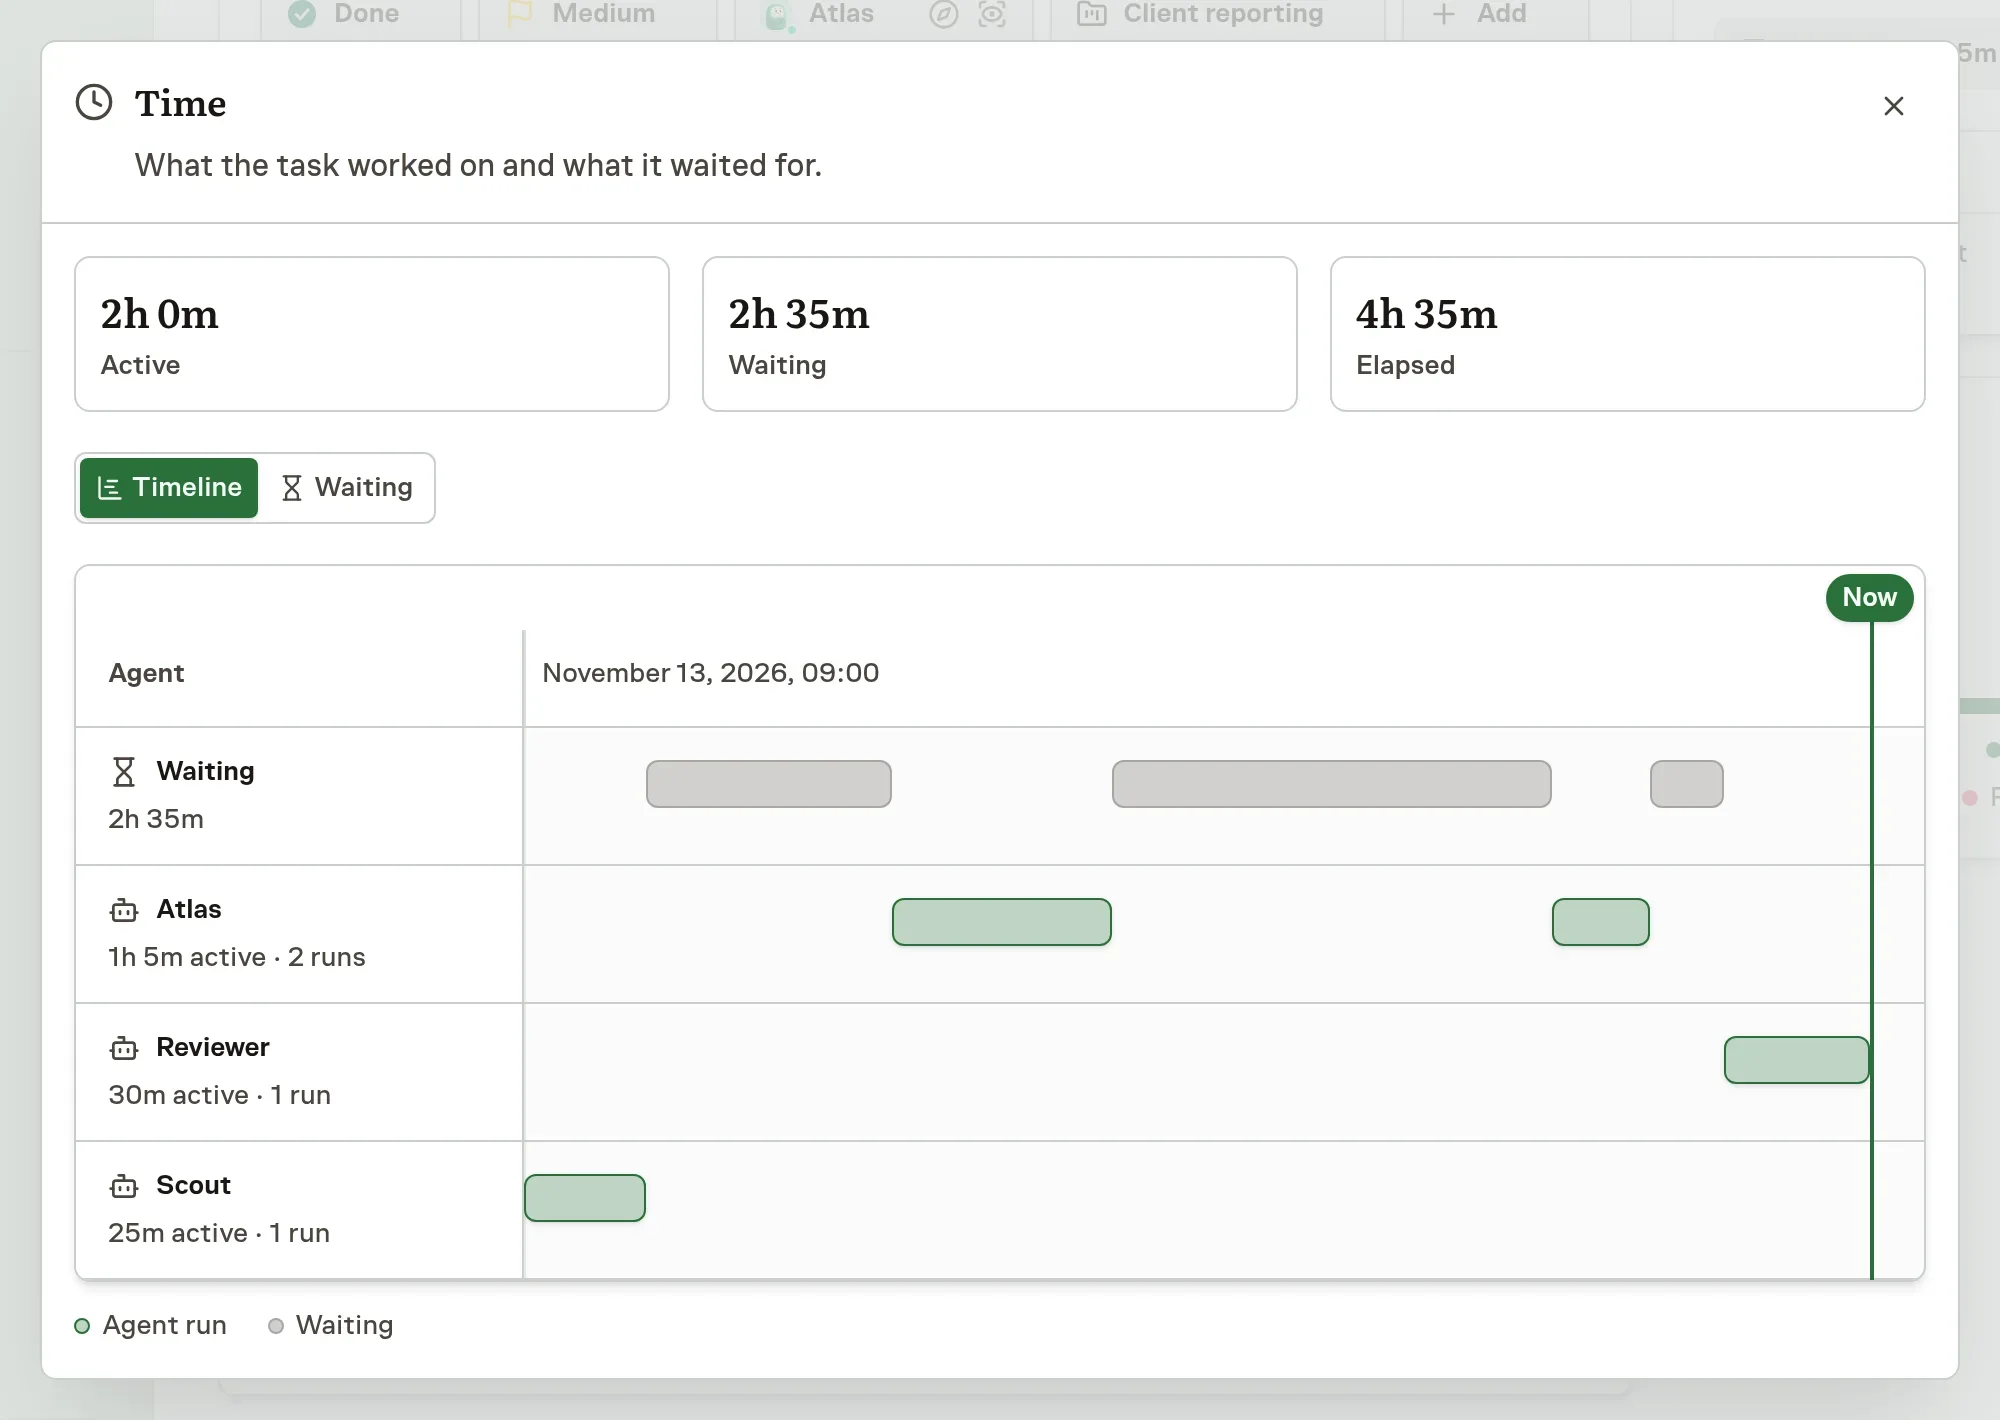
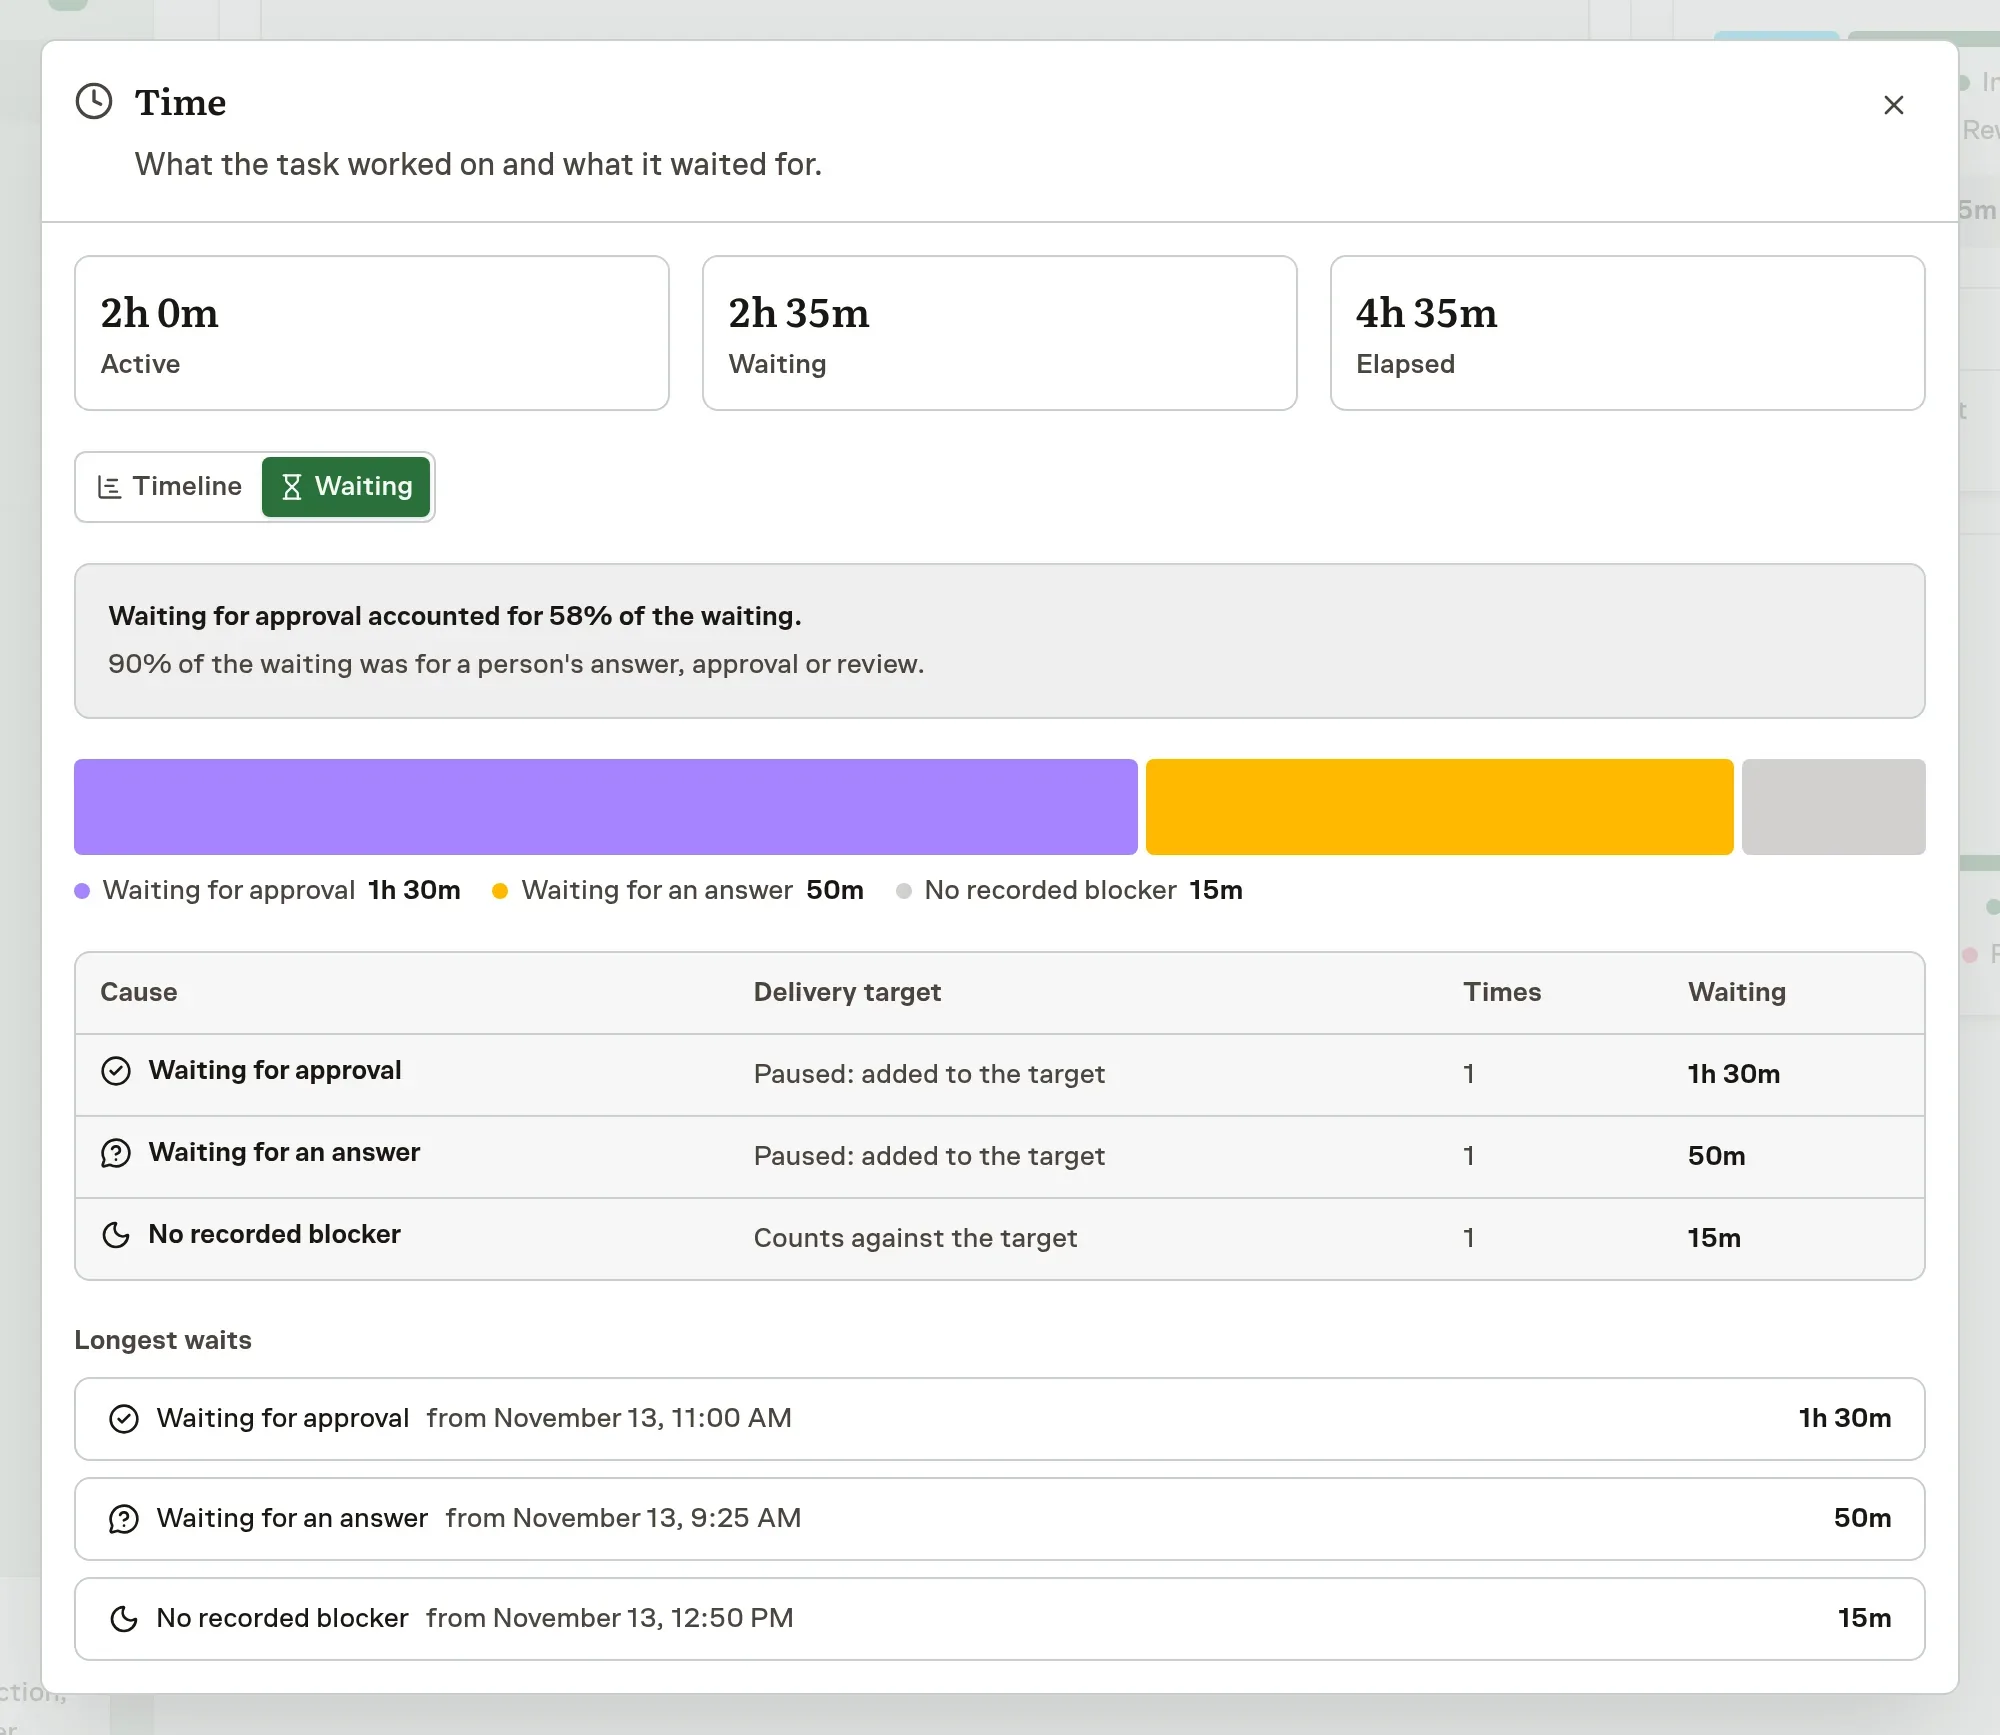
Its Waiting tab breaks down recorded causes, including answers, approvals, dependencies and execution capacity, and explains which waits move the delivery target. Waiting totals and longest waits cover the full counted history, even when the timeline shows only recent runs.
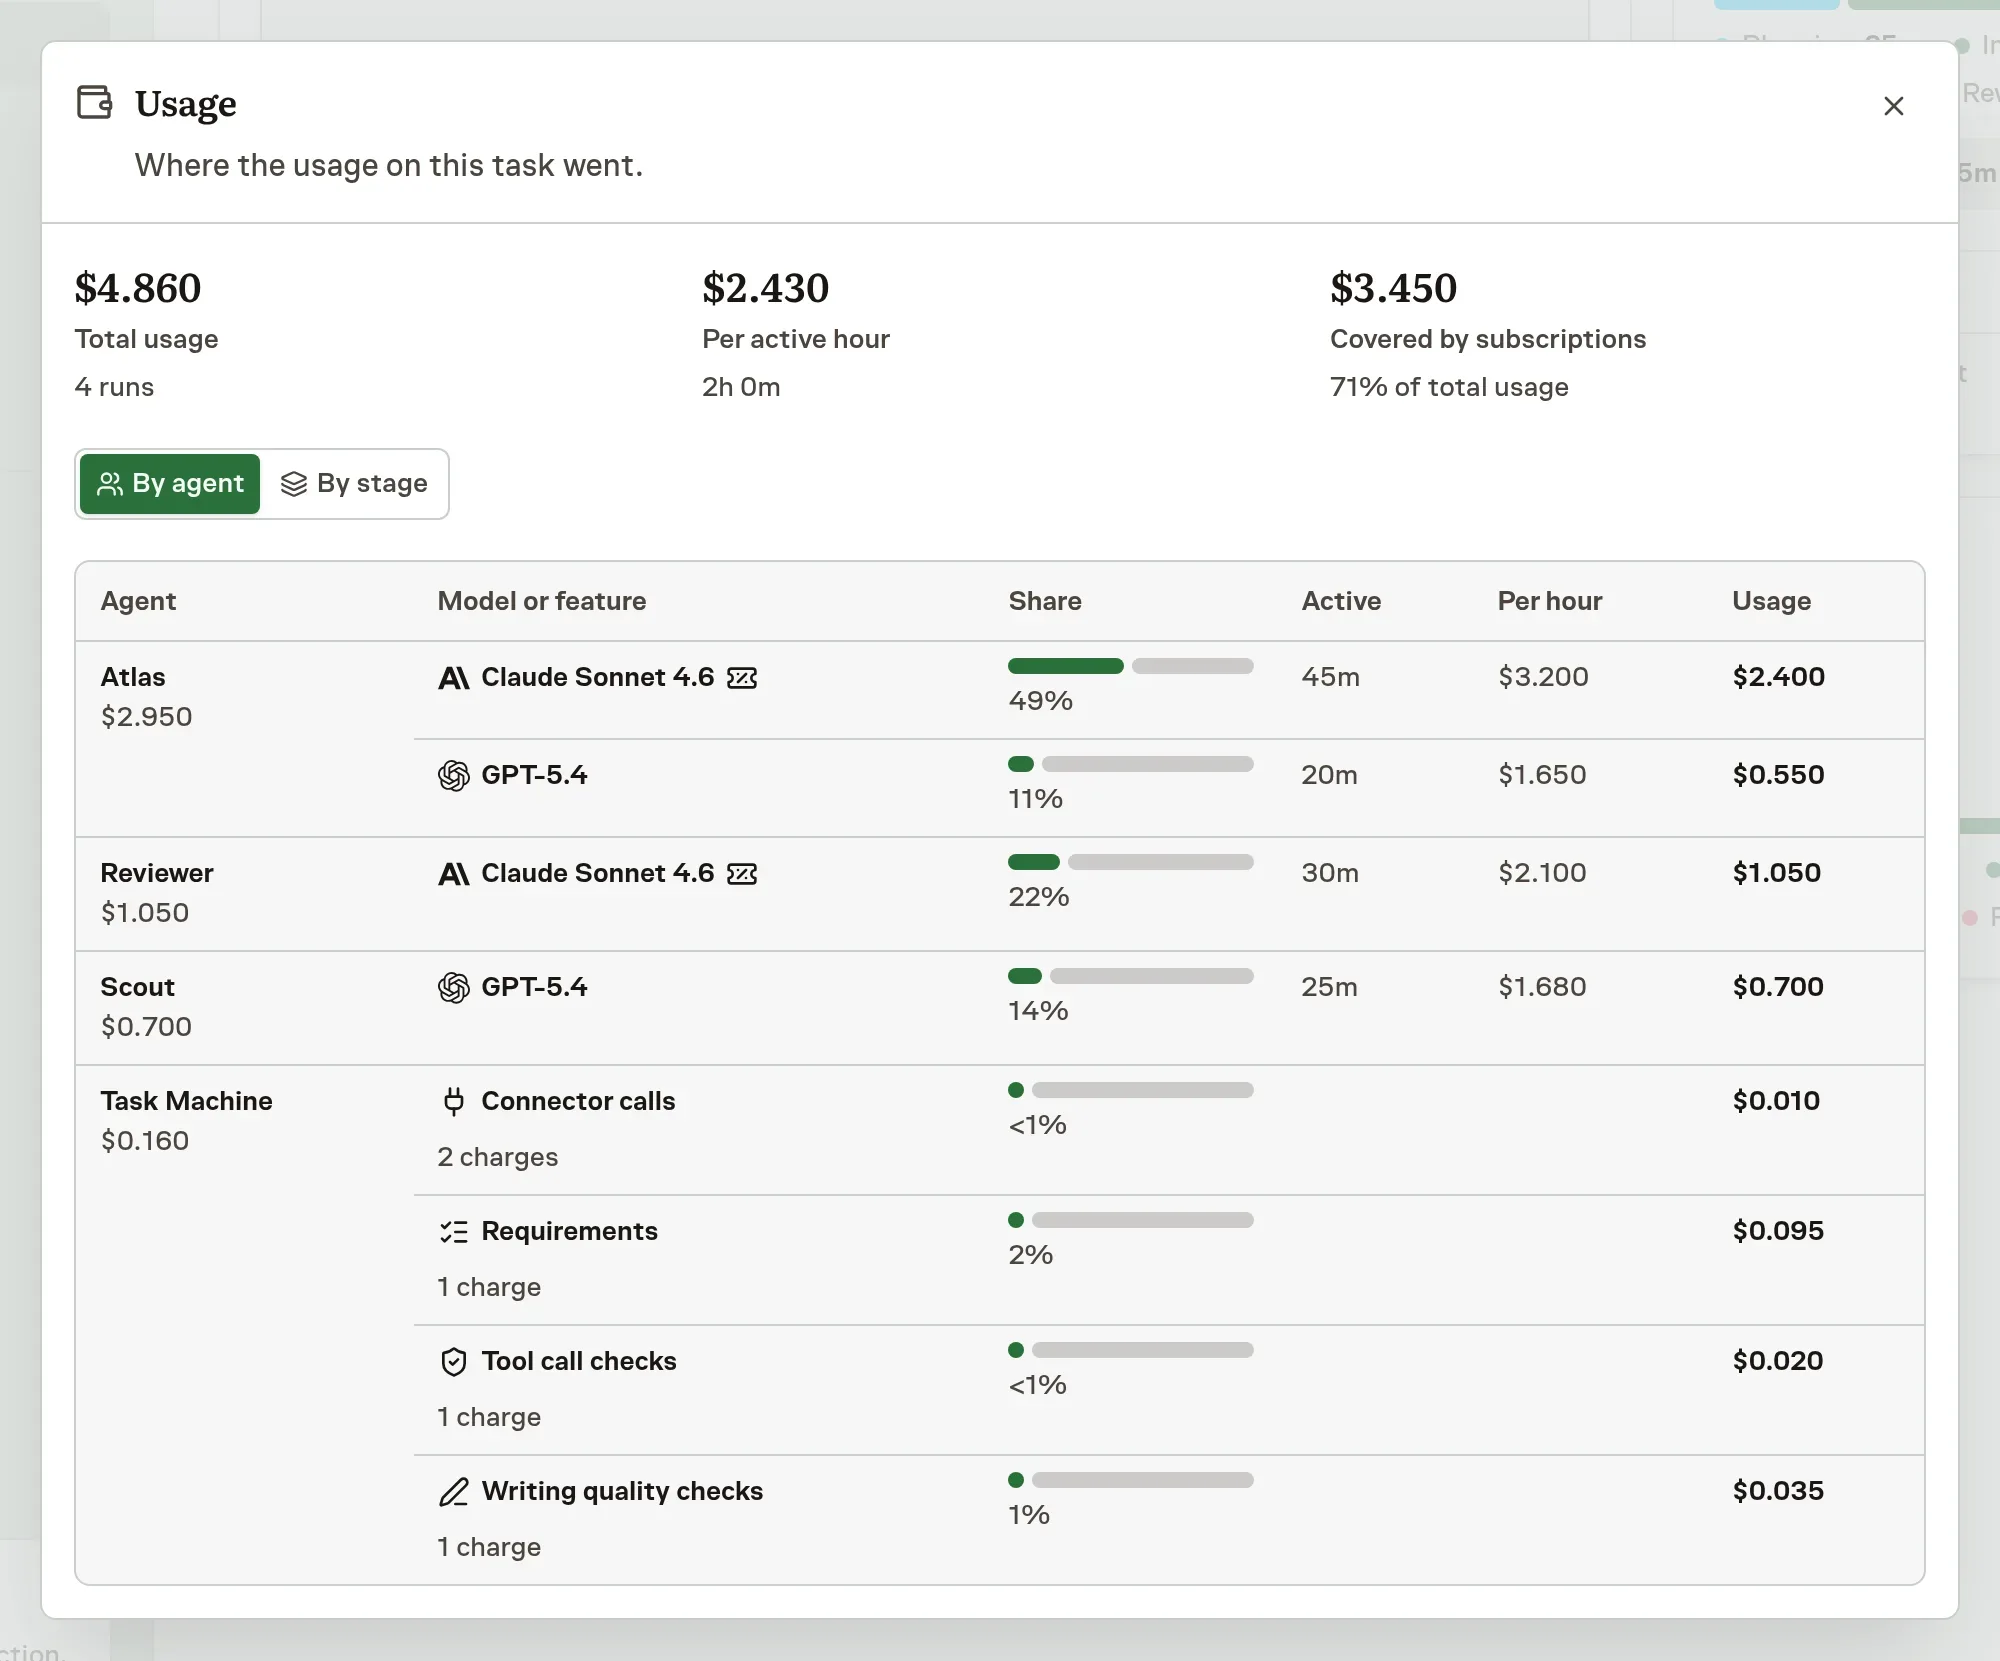
See who and what contributed to usage
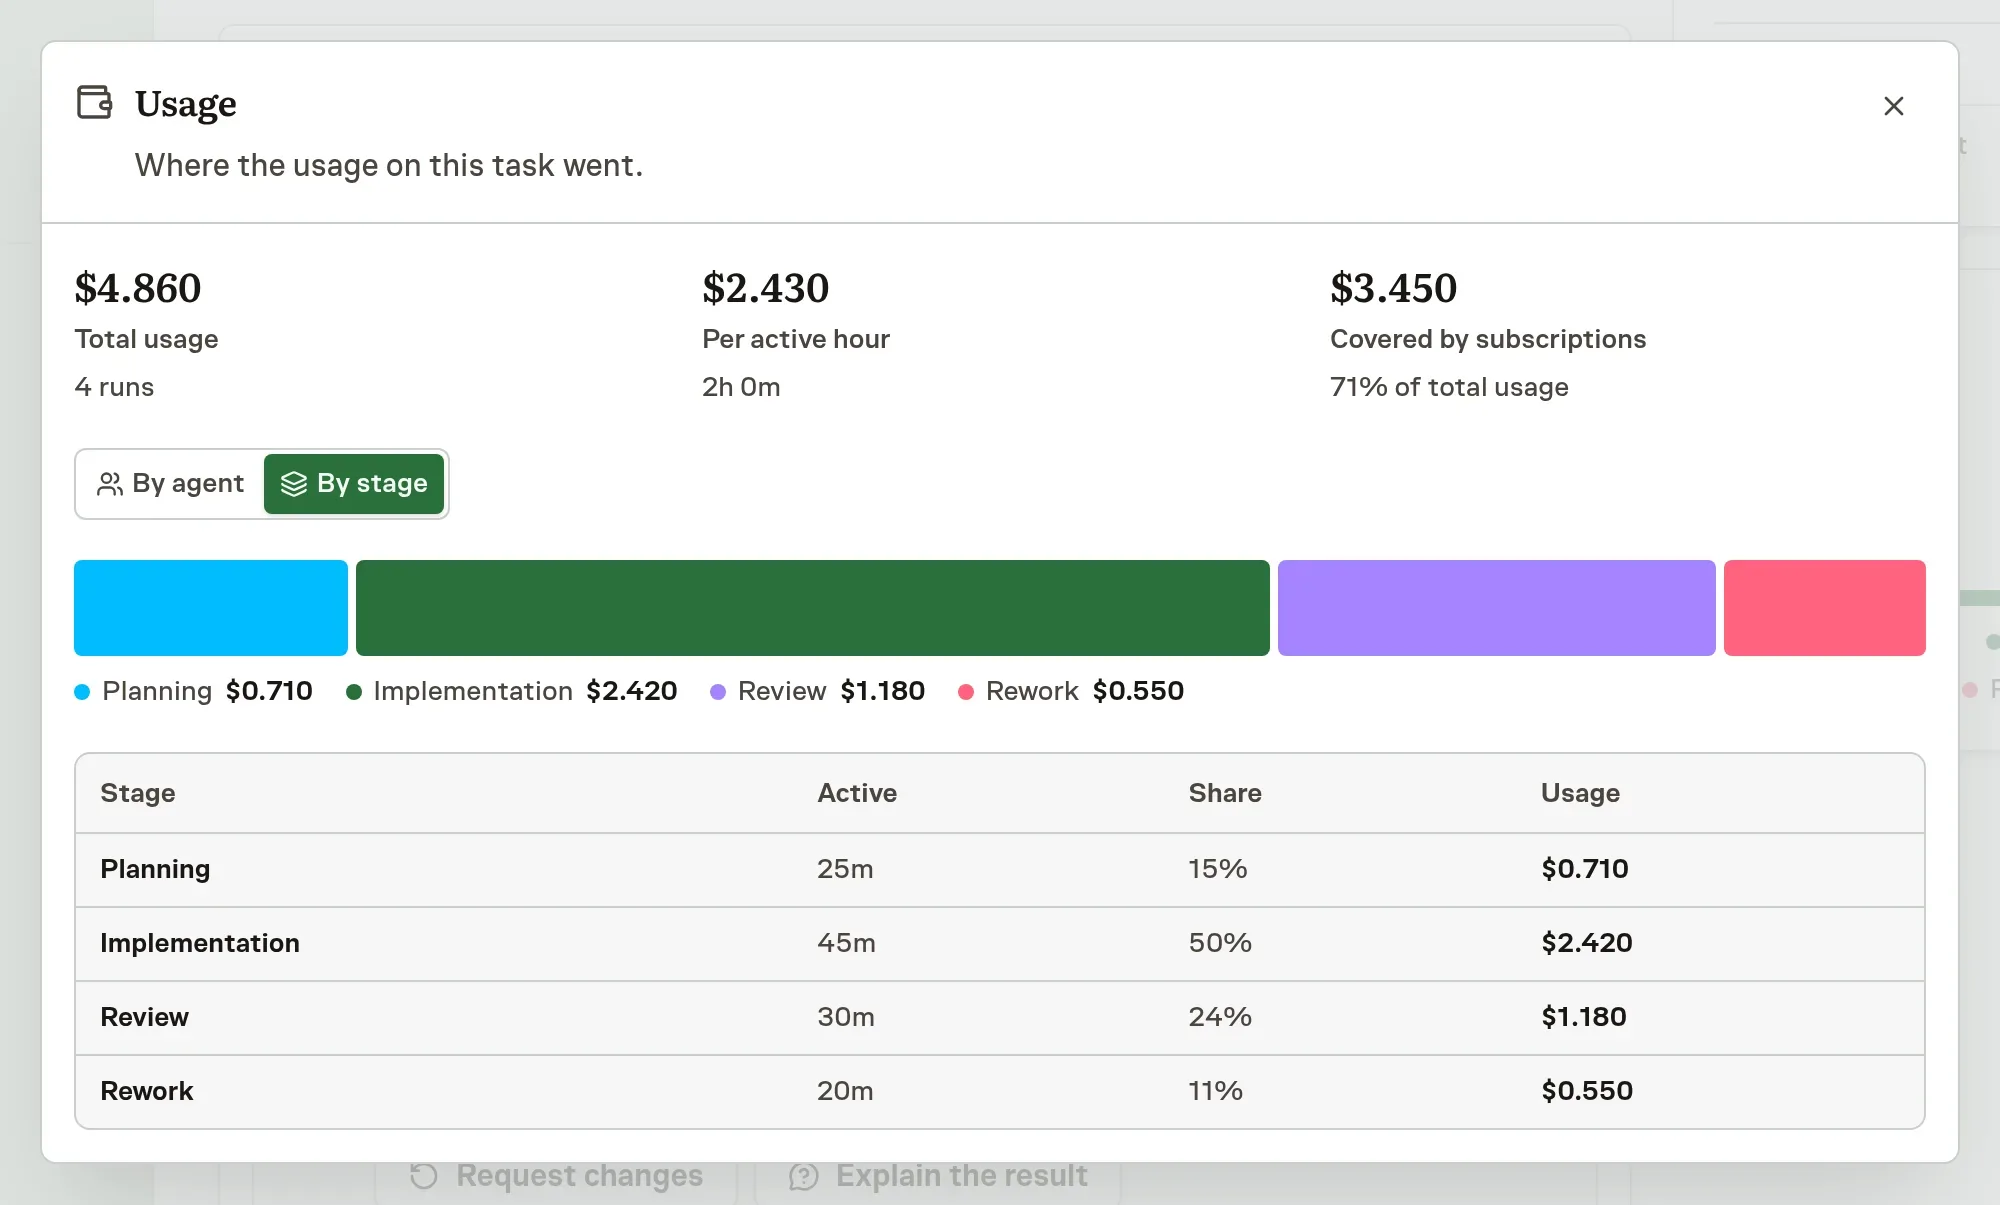
The Usage modal has By agent and By stage views. Each agent's models get their own usage rows and share bars, with reported subscription coverage identified. Where timing is known, you can also see active time and usage per active hour.
A separate Task Machine group shows the task's feature charges and fees, including code review, tool-call checks and Connector calls.
The stage view brings together usage across implementation, review and other work.
Open View details on either card to inspect the breakdown. Existing time-counting and charging rules are unchanged.
Read Duration and usage for the full details.