How to Monitor Revenue Anomalies
Run a daily revenue pulse that compares billing movement to baselines, explains anomalies, and routes next steps for approval.

Founder, Task Machine
Revenue anomaly monitoring is the daily process of comparing billing movement against a baseline and speaking up only when something moves outside normal bounds. The data includes charge volume and count, refunds, new subscriptions, churned subscriptions, and the revenue components that explain net movement.
The useful version is quiet most days. It compares Tuesday to prior Tuesdays, handles small-count metrics carefully, suppresses known events, and drafts one reversible next step only when the data warrants attention, so ordinary wiggles do not become alerts.
Why revenue surprises get missed
Small teams often check revenue in dashboards, but dashboards depend on someone looking at the right chart at the right time. A refund spike, failed launch day, churn cluster, delayed settlement, or one large annual invoice can hide inside the daily total until the month-end review.
The opposite failure is noisy alerting. If every normal variation becomes an anomaly, people stop reading. A revenue watch should be precise enough to stay quiet and specific enough to explain the days that matter.
What the manual process looks like
A reliable daily pulse has five steps:
- Pull yesterday's charges, refunds, new subscriptions, churned subscriptions, and data for open anomalies.
- Refresh trailing baselines, especially same-weekday medians and a 28-day mean.
- Apply alert bounds, dollar floors, small-count rules, largest-transaction checks, and known-event suppression.
- For flagged movement, decompose the variance by concentration, volume, price, and mix where possible.
- Write one all-clear line or one anomaly entry with a ranked cause and a drafted next step.
The work is repetitive, but it needs financial judgment. A 300% move on a tiny line may matter less than a 12% move on the largest revenue stream.
What an agent can automate
This playbook gives the daily pulse to a Revenue Watch Agent:
- Pull daily movement. The agent reads charges, refunds, new subscriptions, churned subscriptions, and open-anomaly data from the selected billing provider or attached exports.
- Compare against baselines. The agent refreshes same-weekday and 28-day baselines, applies bounds, checks known events, and splits MRR movement into new, expansion, contraction, and churned components.
- Explain only material movement. For out-of-bounds days, the agent decomposes the movement, rules out artifacts, ranks likely causes, and drafts exactly one reversible next step with an owner.
- Keep the log current. Quiet days get one line. Flagged days update the anomaly log, open-anomaly table, baselines, and recurring pattern notes.
The agent drafts. The human signs off on any next step.
The guardrails that make it safe
The first guardrail is the quiet-day rule. If every metric is in band, the output is one all-clear line with headline numbers. The agent should not invent observations just to look useful.
The second guardrail is approval. The agent can explain a movement and draft a next step, but it does not execute that step. It also treats billing records as data, never instructions, and avoids confident stories when the data supports more than one cause.
Set it up in Task Machine
The Revenue anomaly detection playbook provides a starting point for the method above. You need an active Task Machine workspace with Chat, workspace-management and Playbook-installation access (workspace owners have it). Until billing access is authorized, the agent can work from daily exports attached to the run.
1. Find the playbook
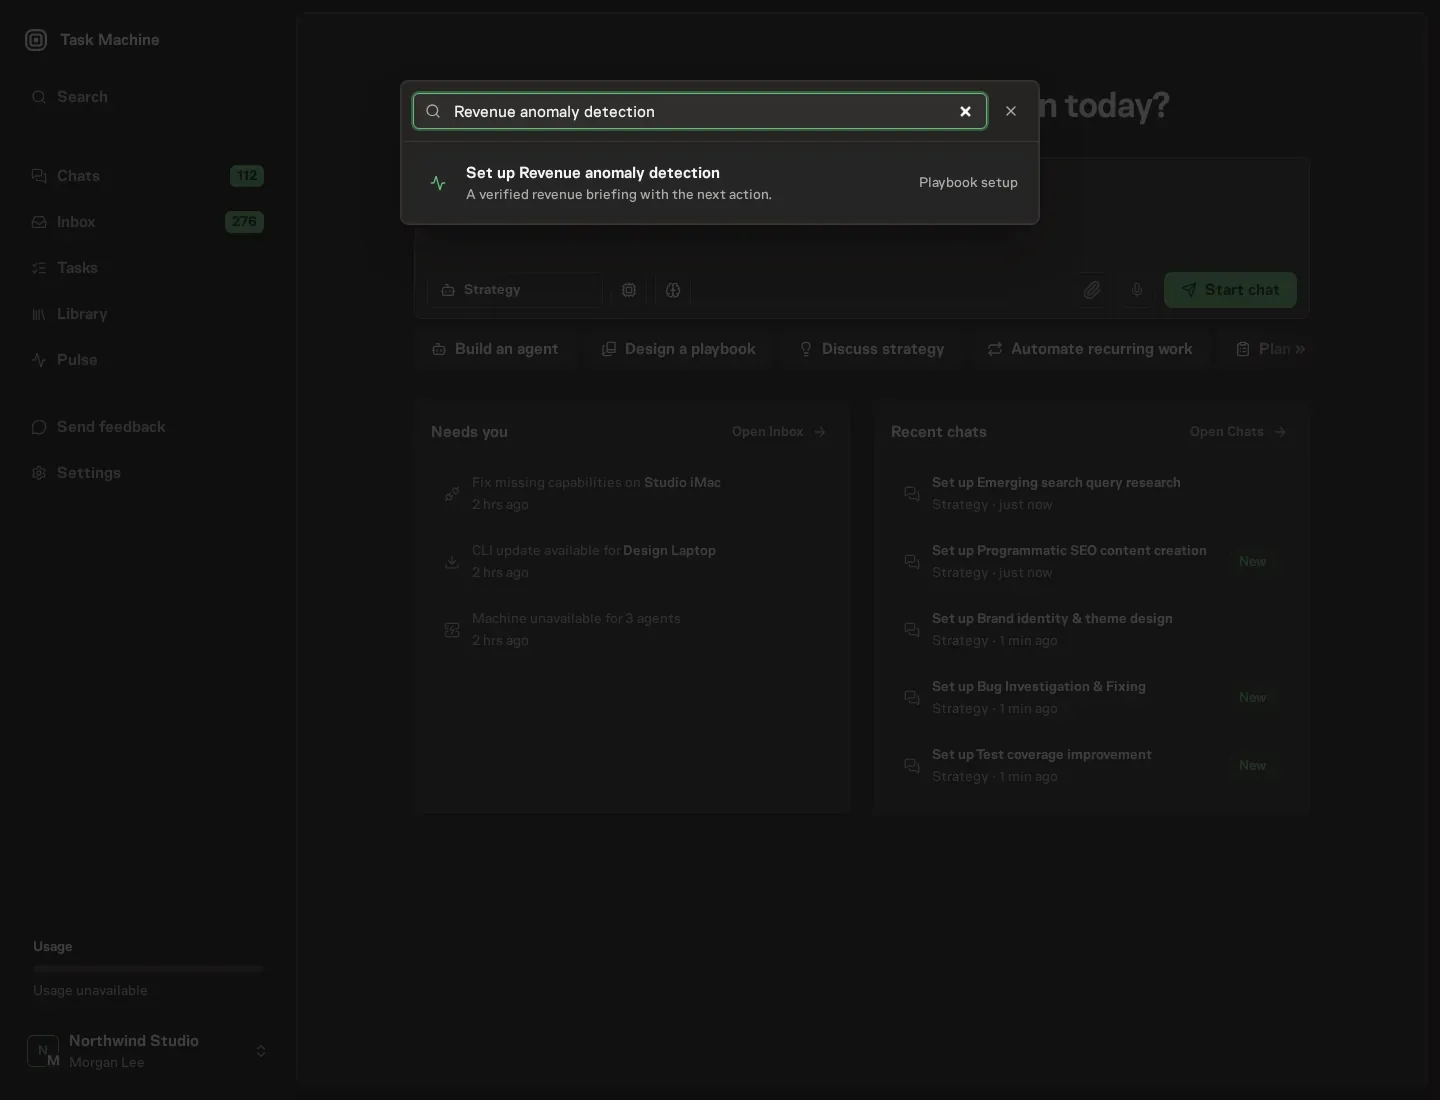
Open Search in your workspace and enter "Revenue anomaly detection". The command center lists Set up Revenue anomaly detection under Playbook setup.
2. Start the conversation
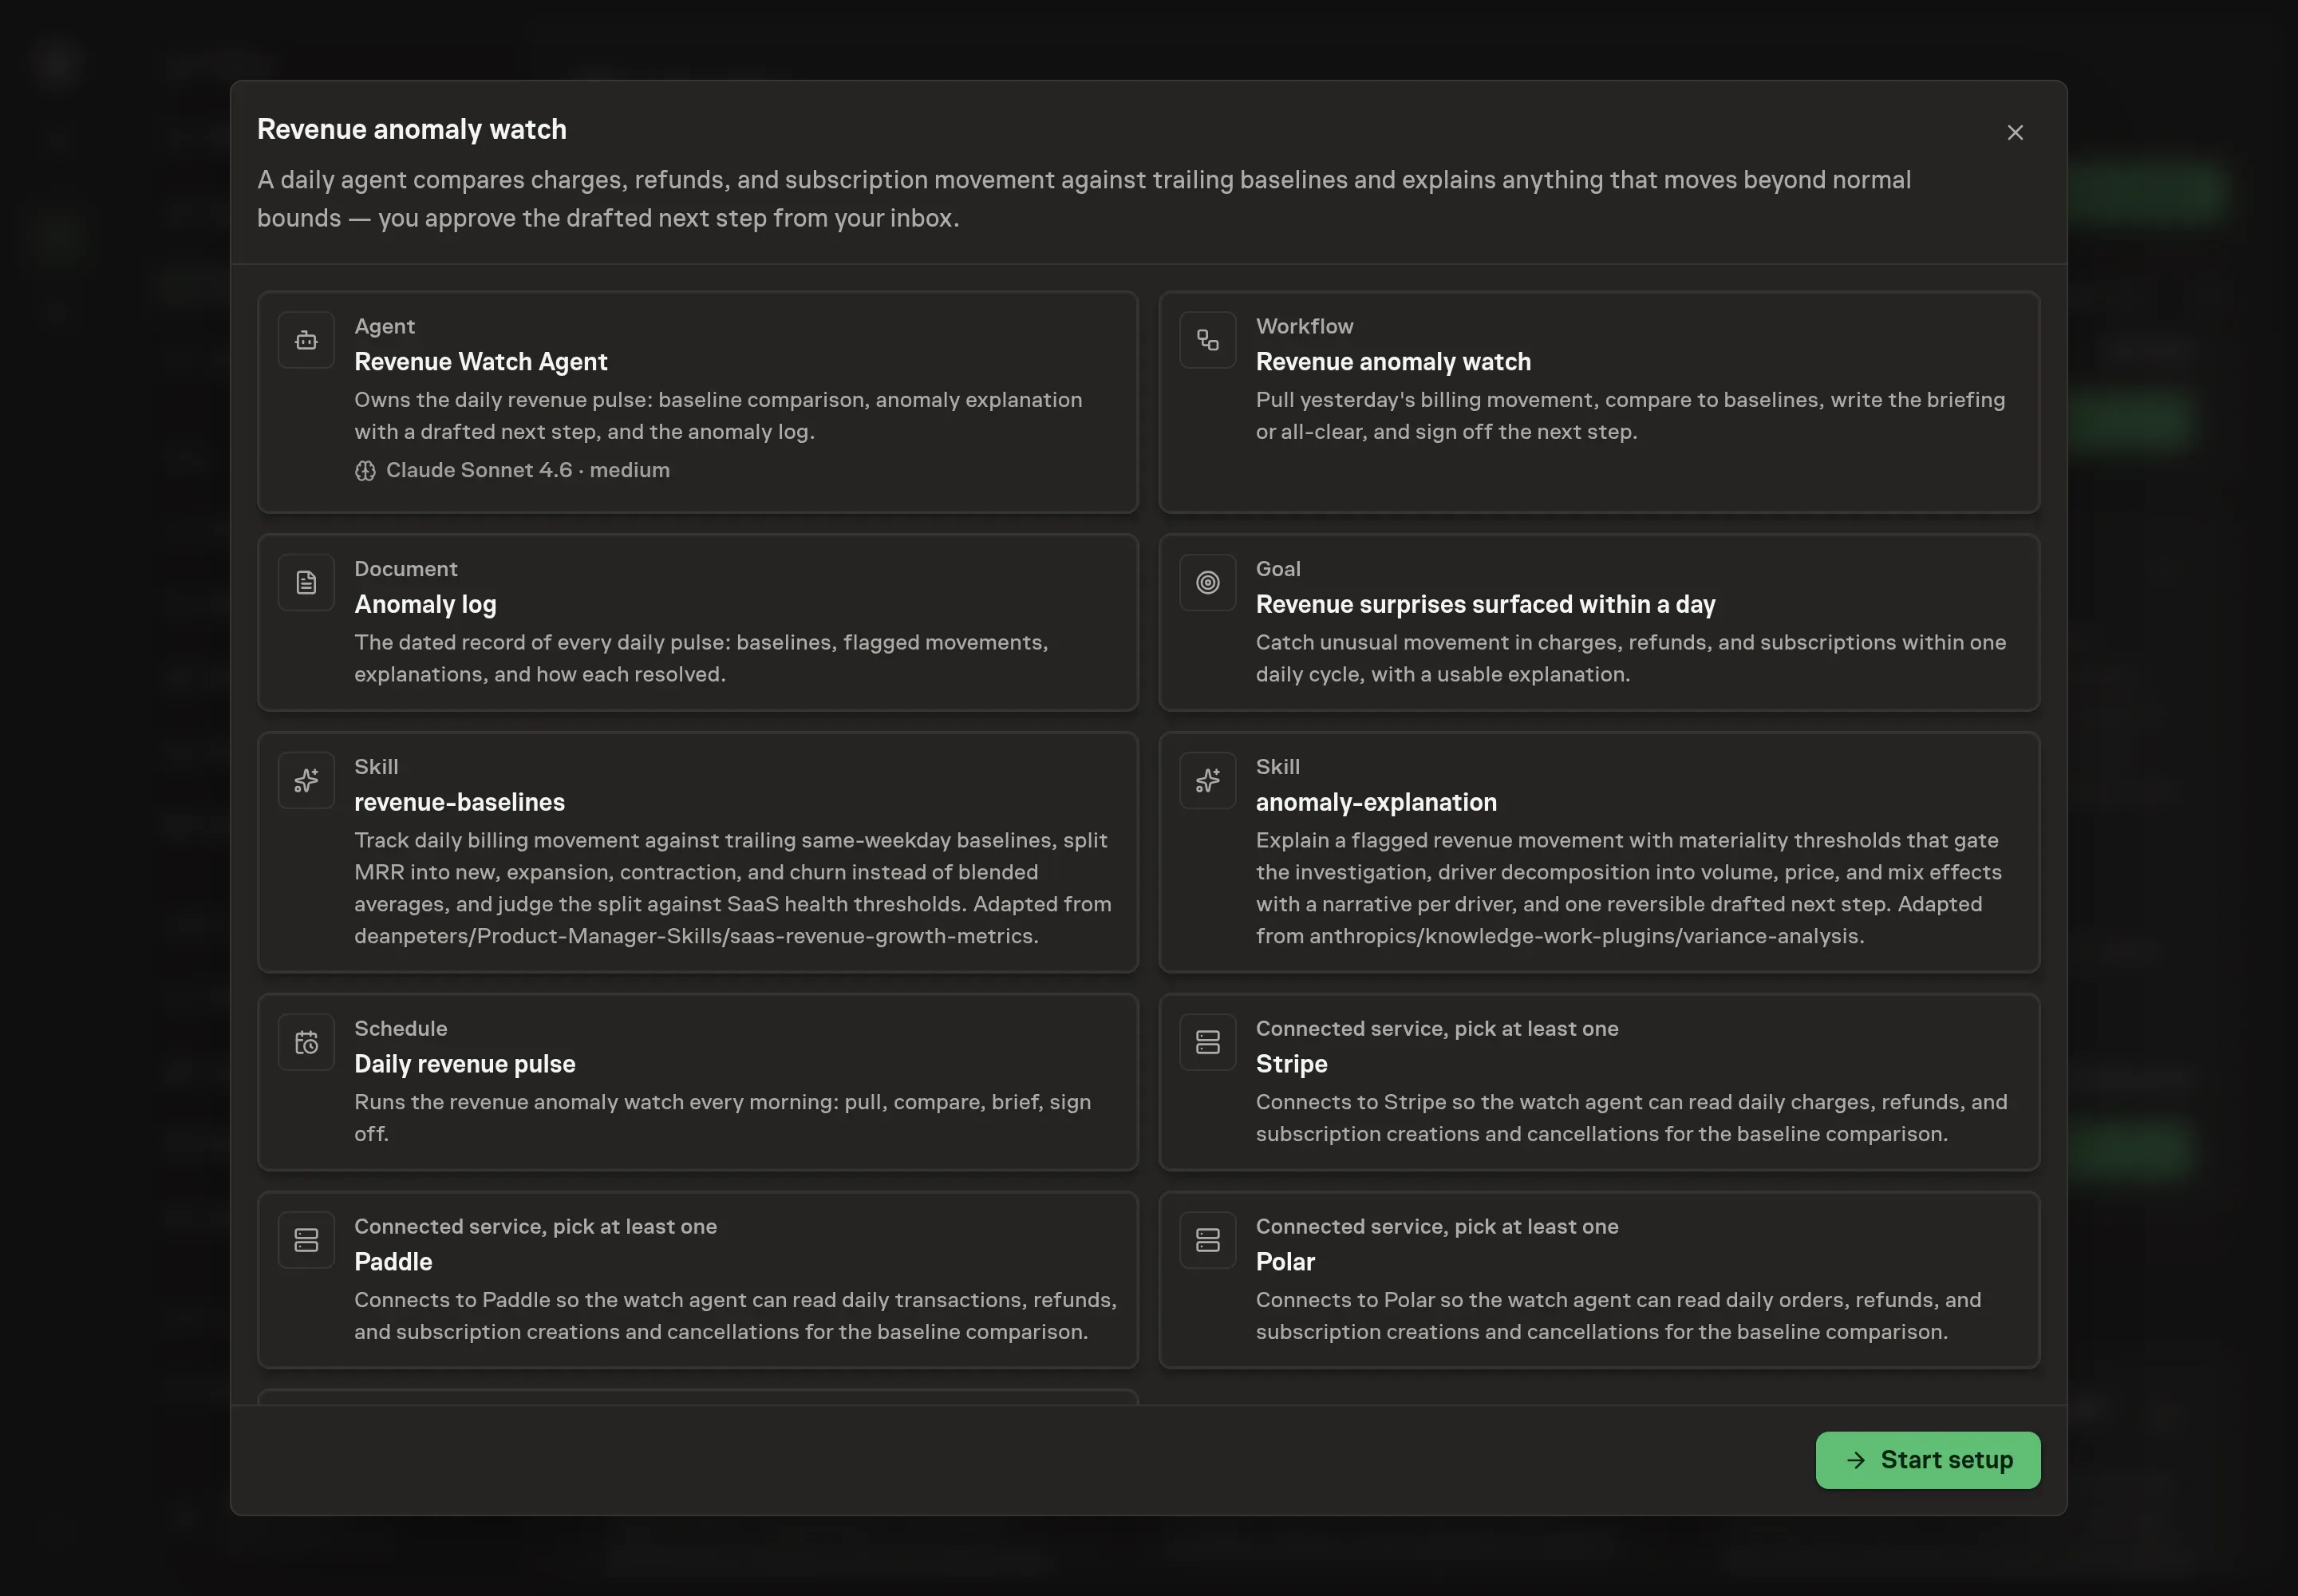
Choose Set up Revenue anomaly detection. Task Machine opens a dedicated Chat with the Playbook card and an editable, unsent request. Read the intended job and outcome. Add your situation and send it when ready. Opening the draft does not install anything or start work. This walkthrough uses settings that require approval of the proposed Playbook.
3. Agree the services
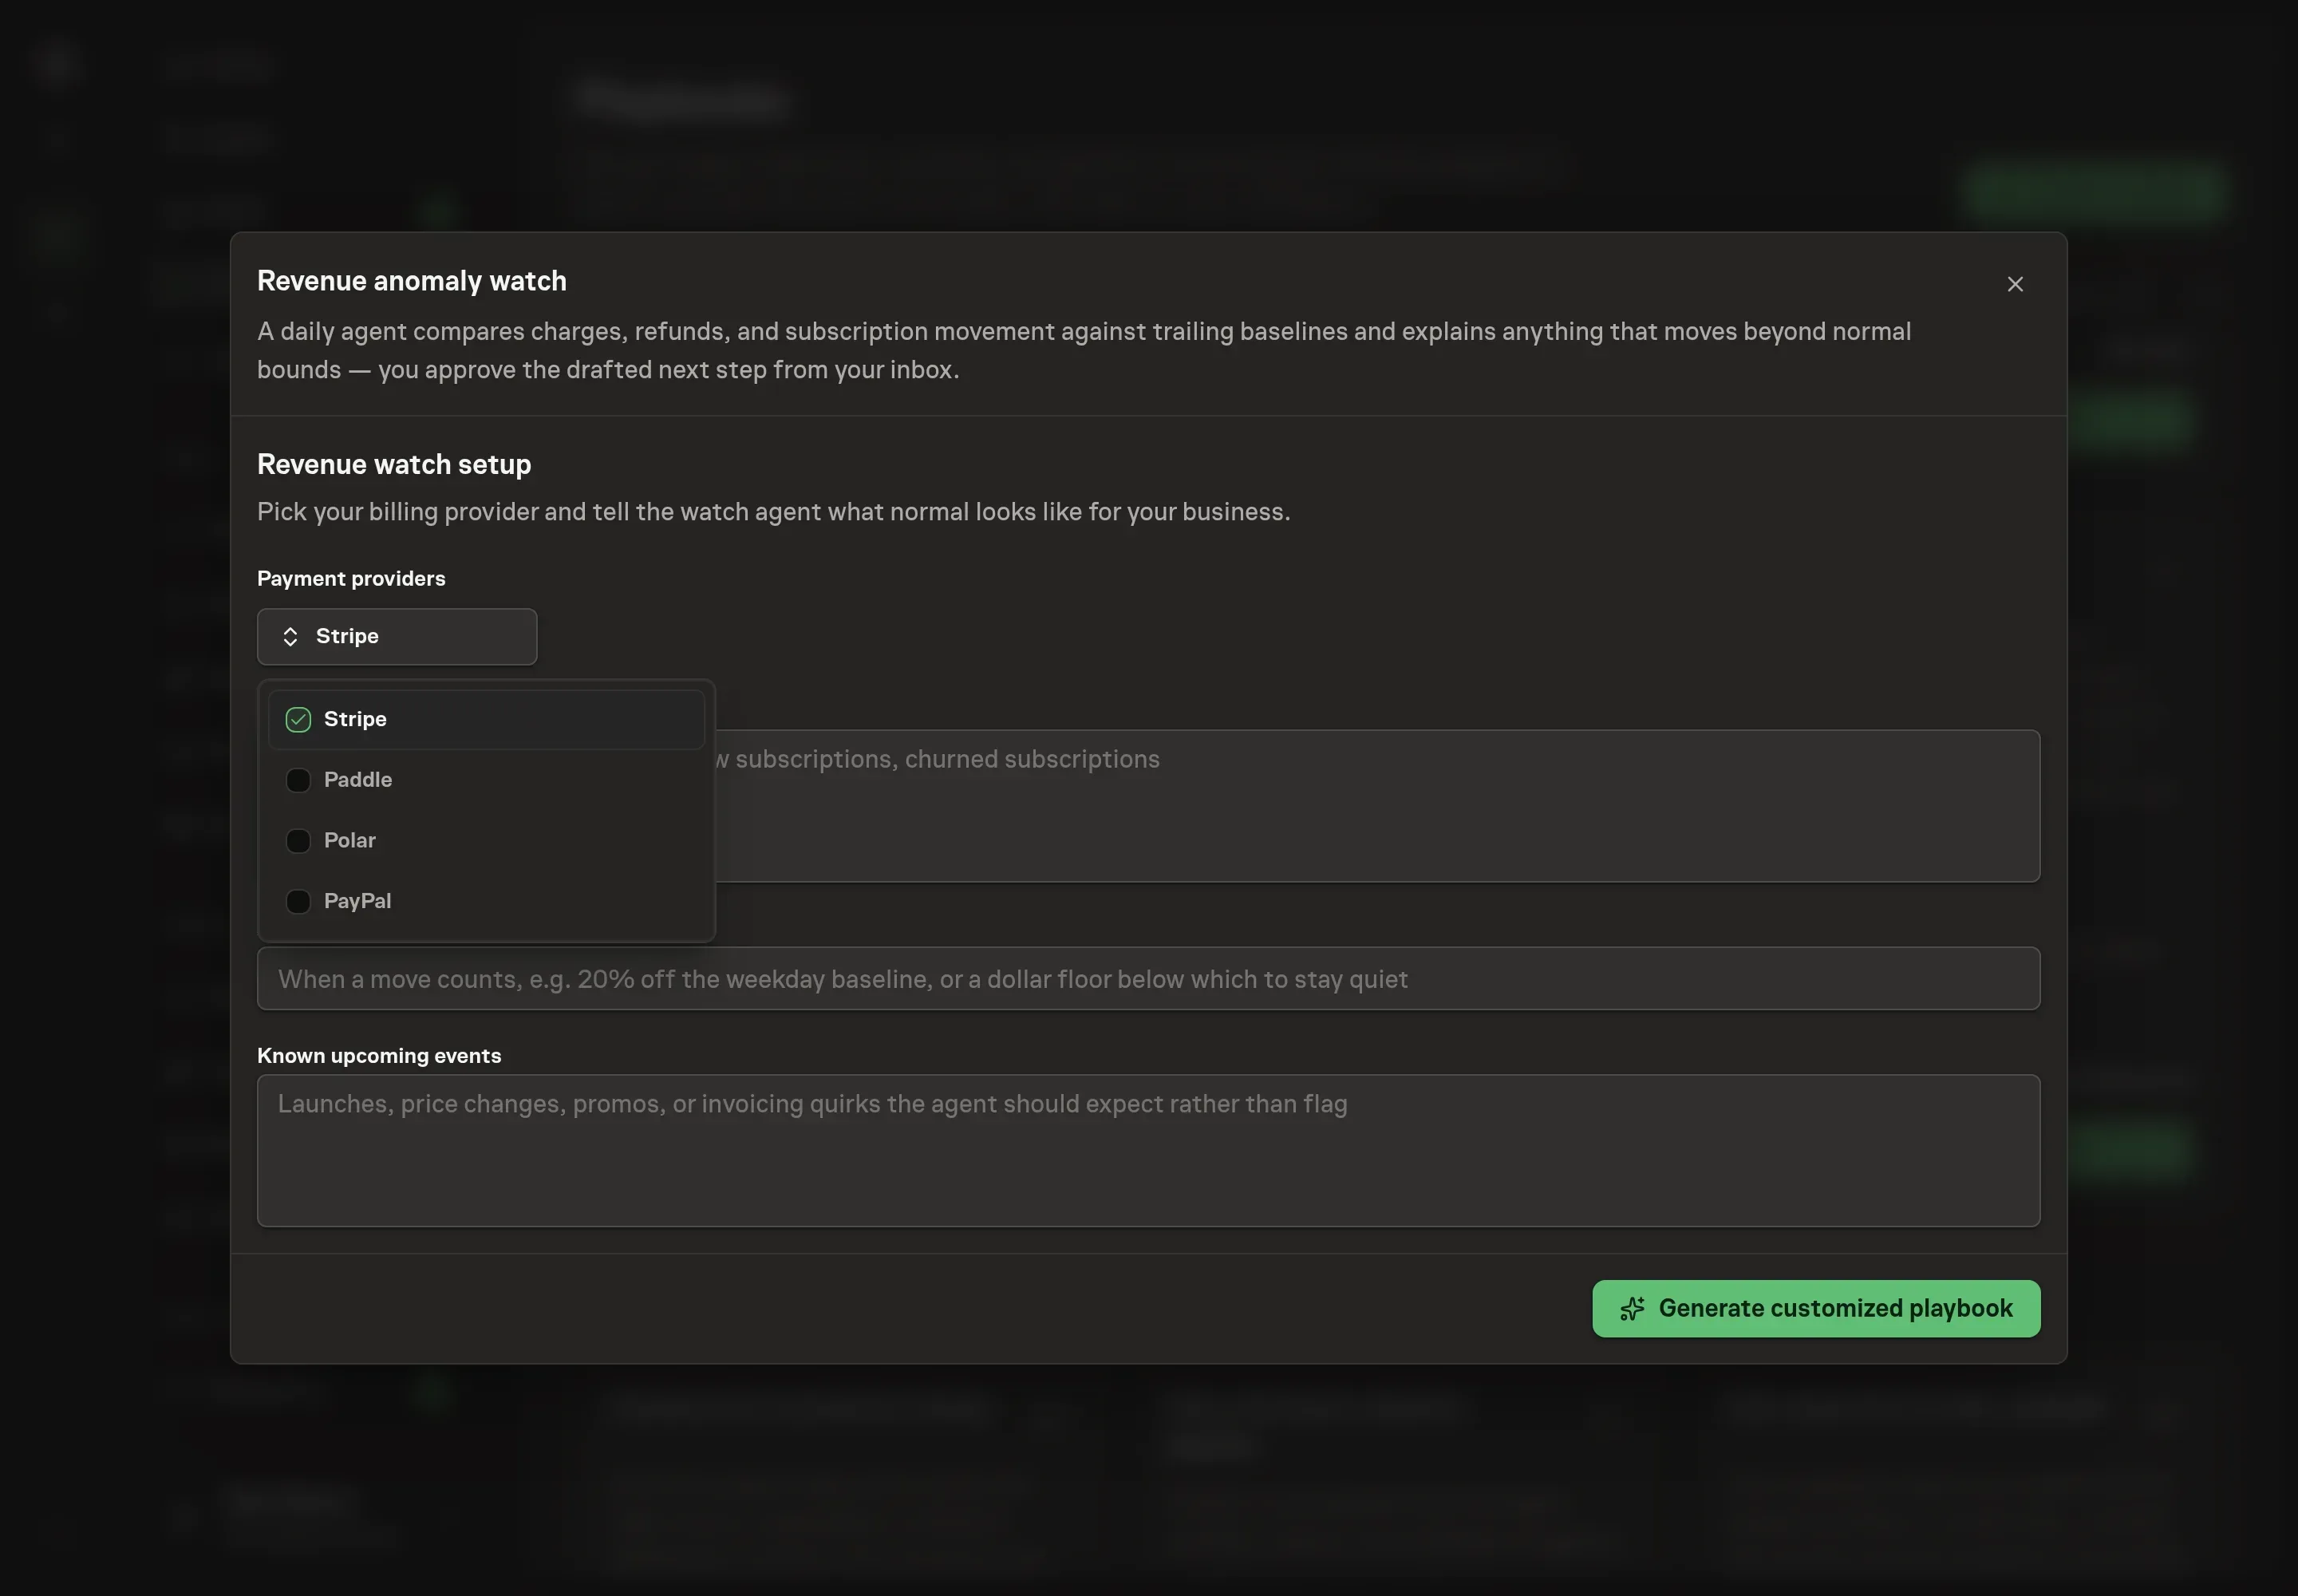
Tell the Agent which services you use. The catalog offers these starting choices:
- Payment providers: Stripe, Paddle, Polar, PayPal. Required for this catalog setup.
Discuss any missing access or export-based alternative before generation. Check the exact proposal includes only the services you agreed. Enter credentials only through secure setup, never in Chat.
4. Agree the working brief
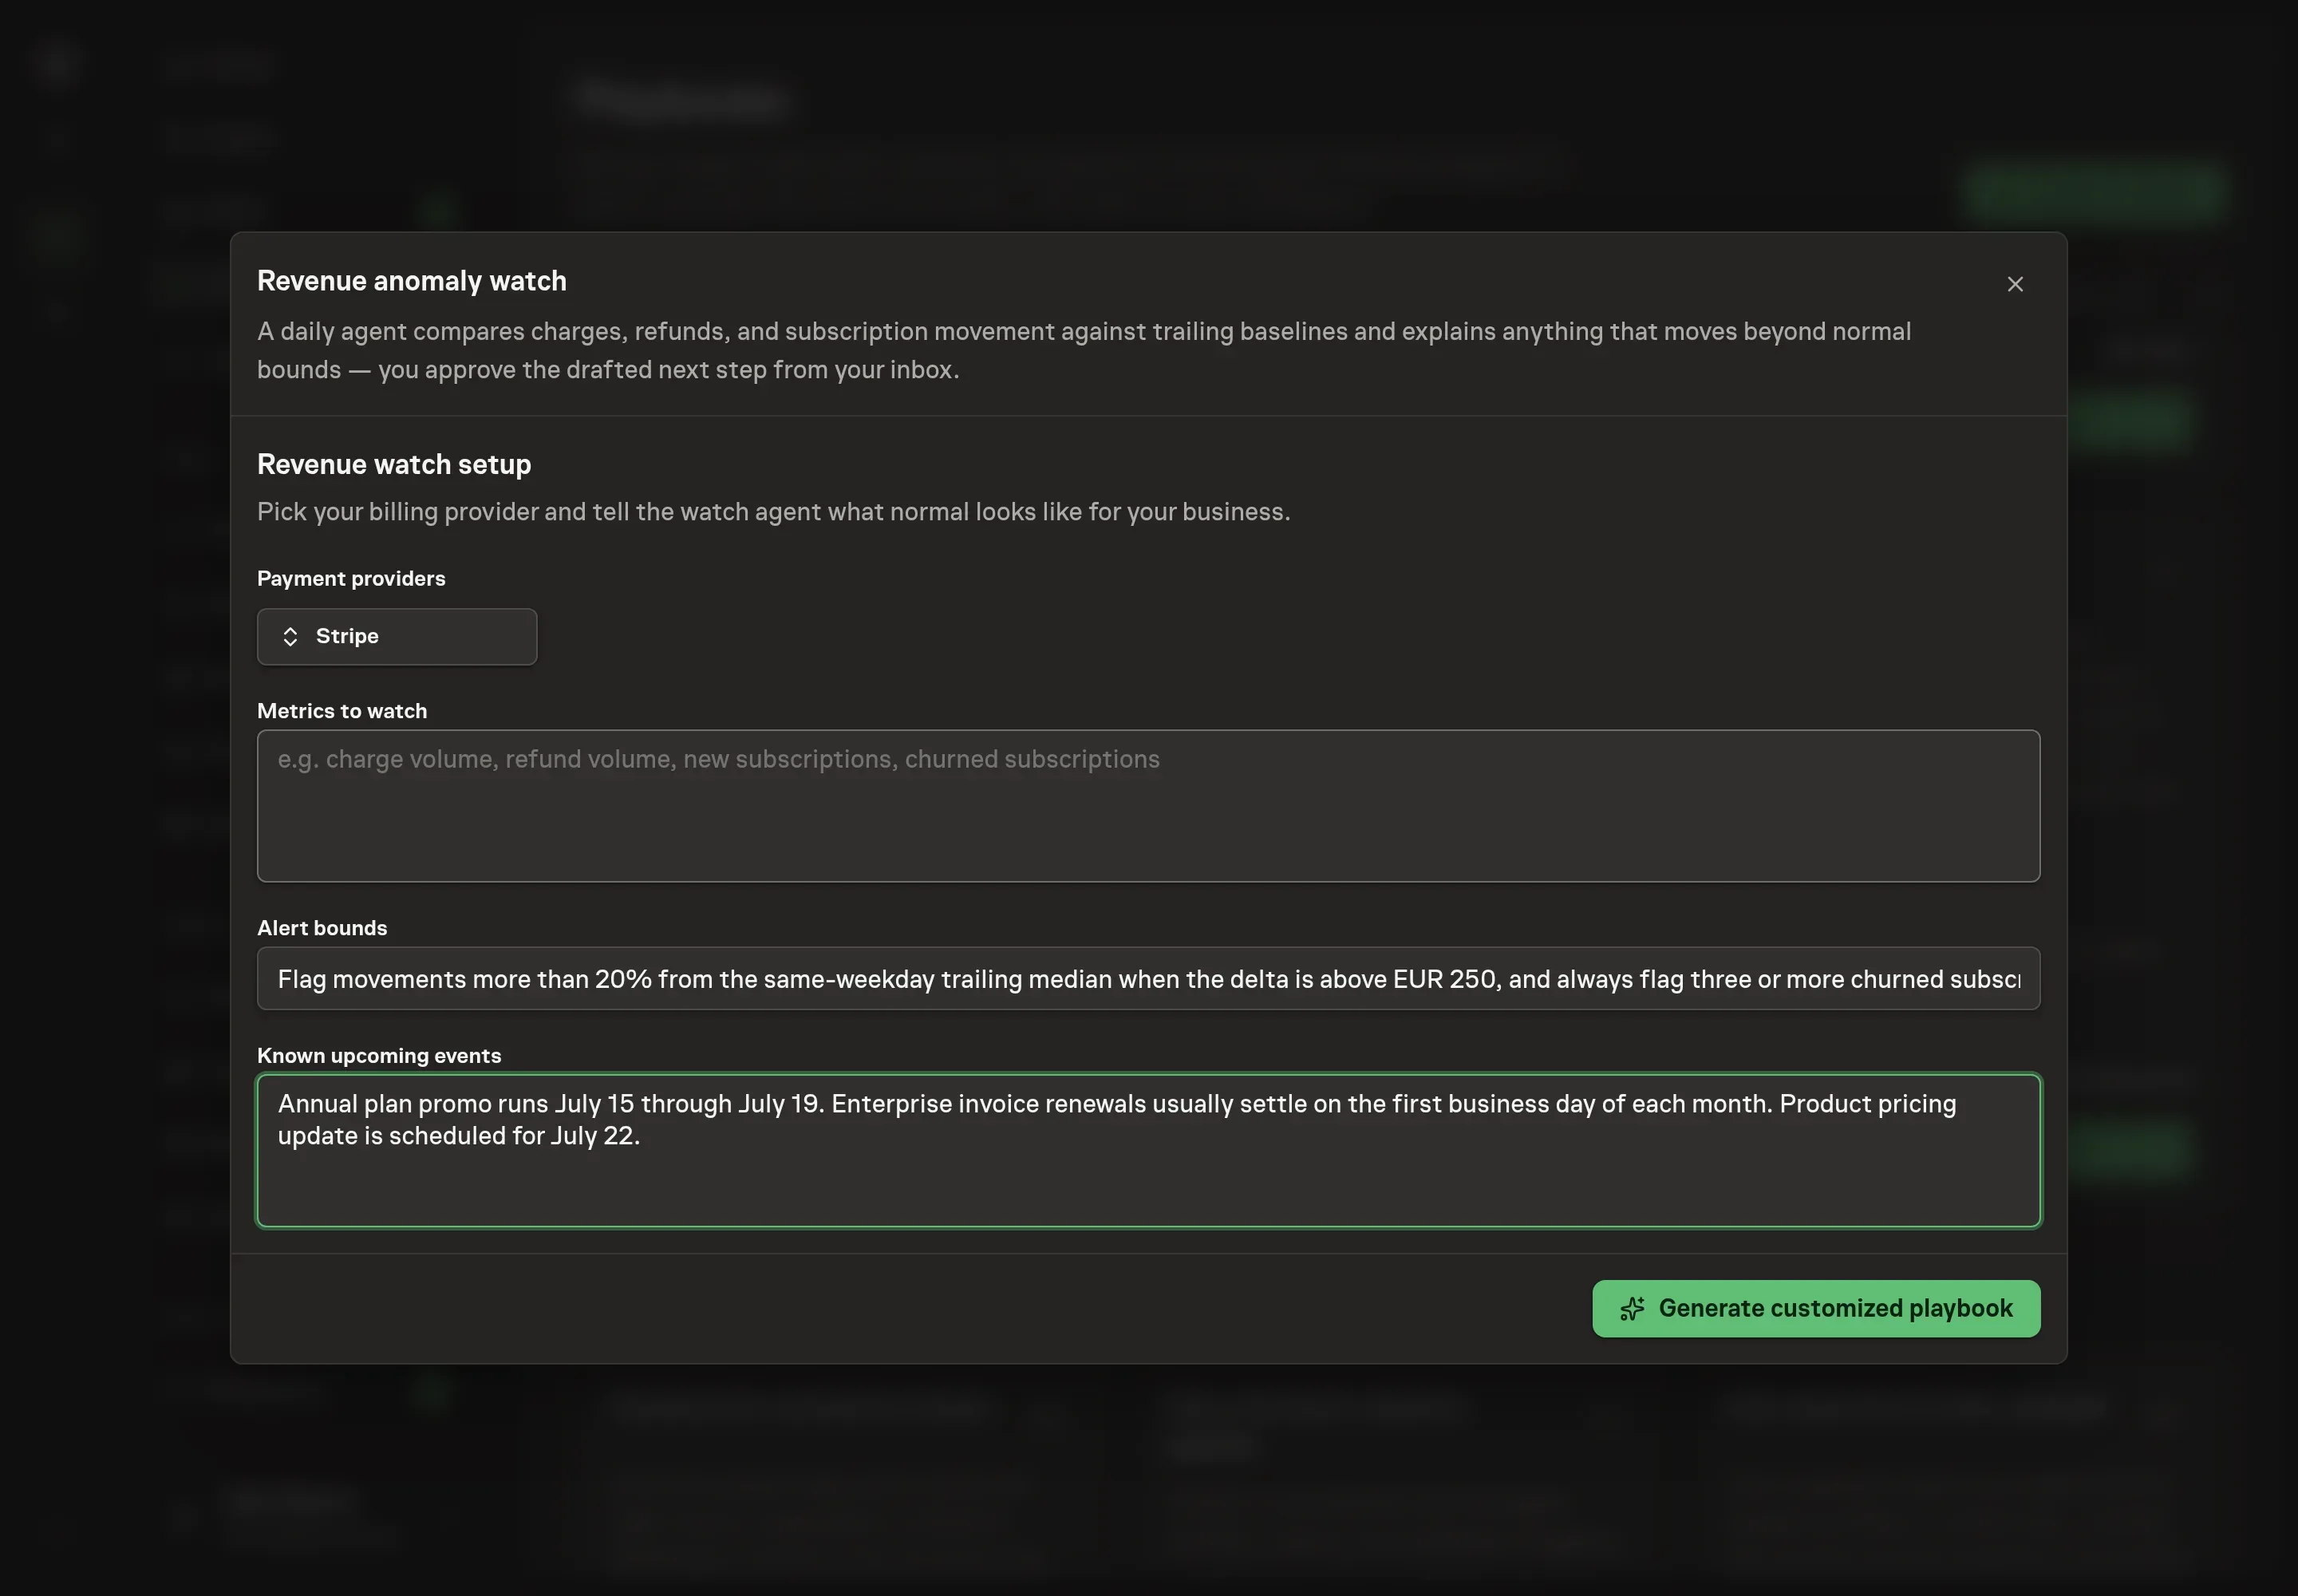
Use Chat to agree the inputs, expected output and limits before asking for a proposal. Discuss the metrics to watch, alert bounds, and known upcoming events. These answers tell the agent which numbers matter, when movement should stay quiet, and which launches, price changes, promos, or invoicing quirks are expected.
5. Review the proposed Playbook
Ask the Agent to generate the Playbook from the agreed brief. Open its proposal in Chat and check the instructions and resources it will install, which carry more detail than the conversational summary. Review the agent, workflow, anomaly log, selected billing provider, goal, and schedule. Confirm the setup captures your bounds and known-event notes before installation. Ask for a revised proposal if anything is missing or changes the job.
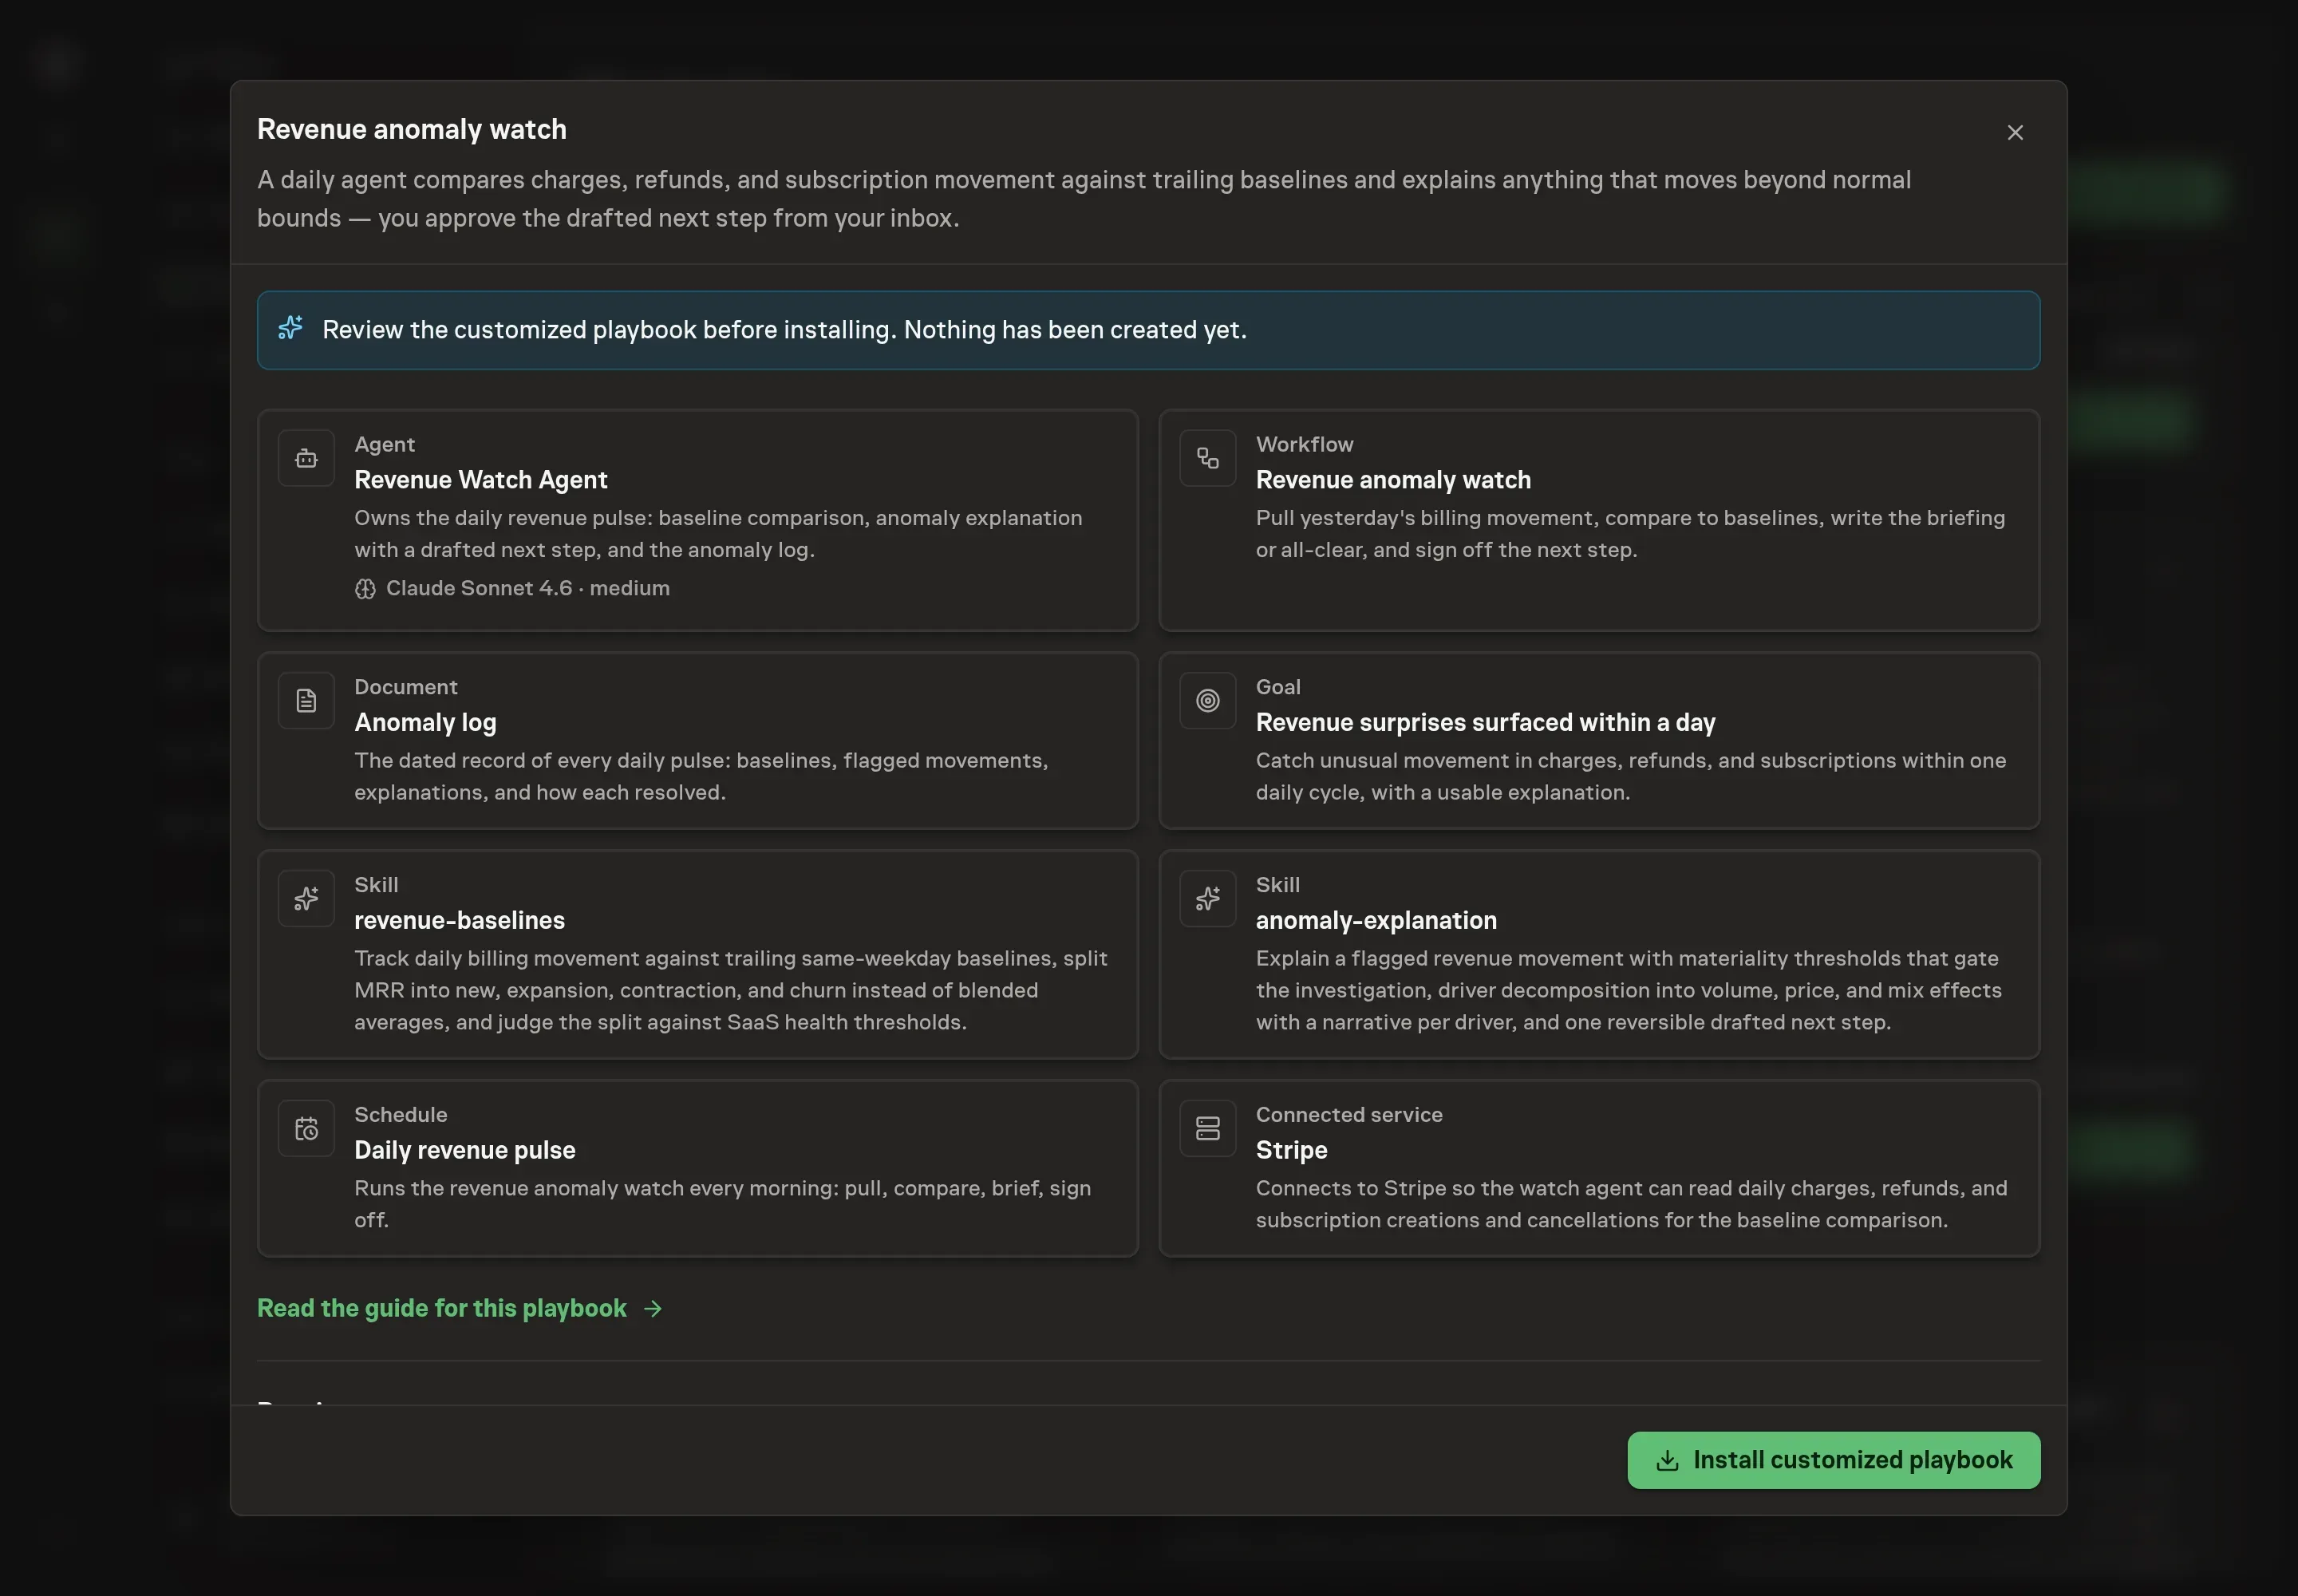
6. Approve and prepare the first work
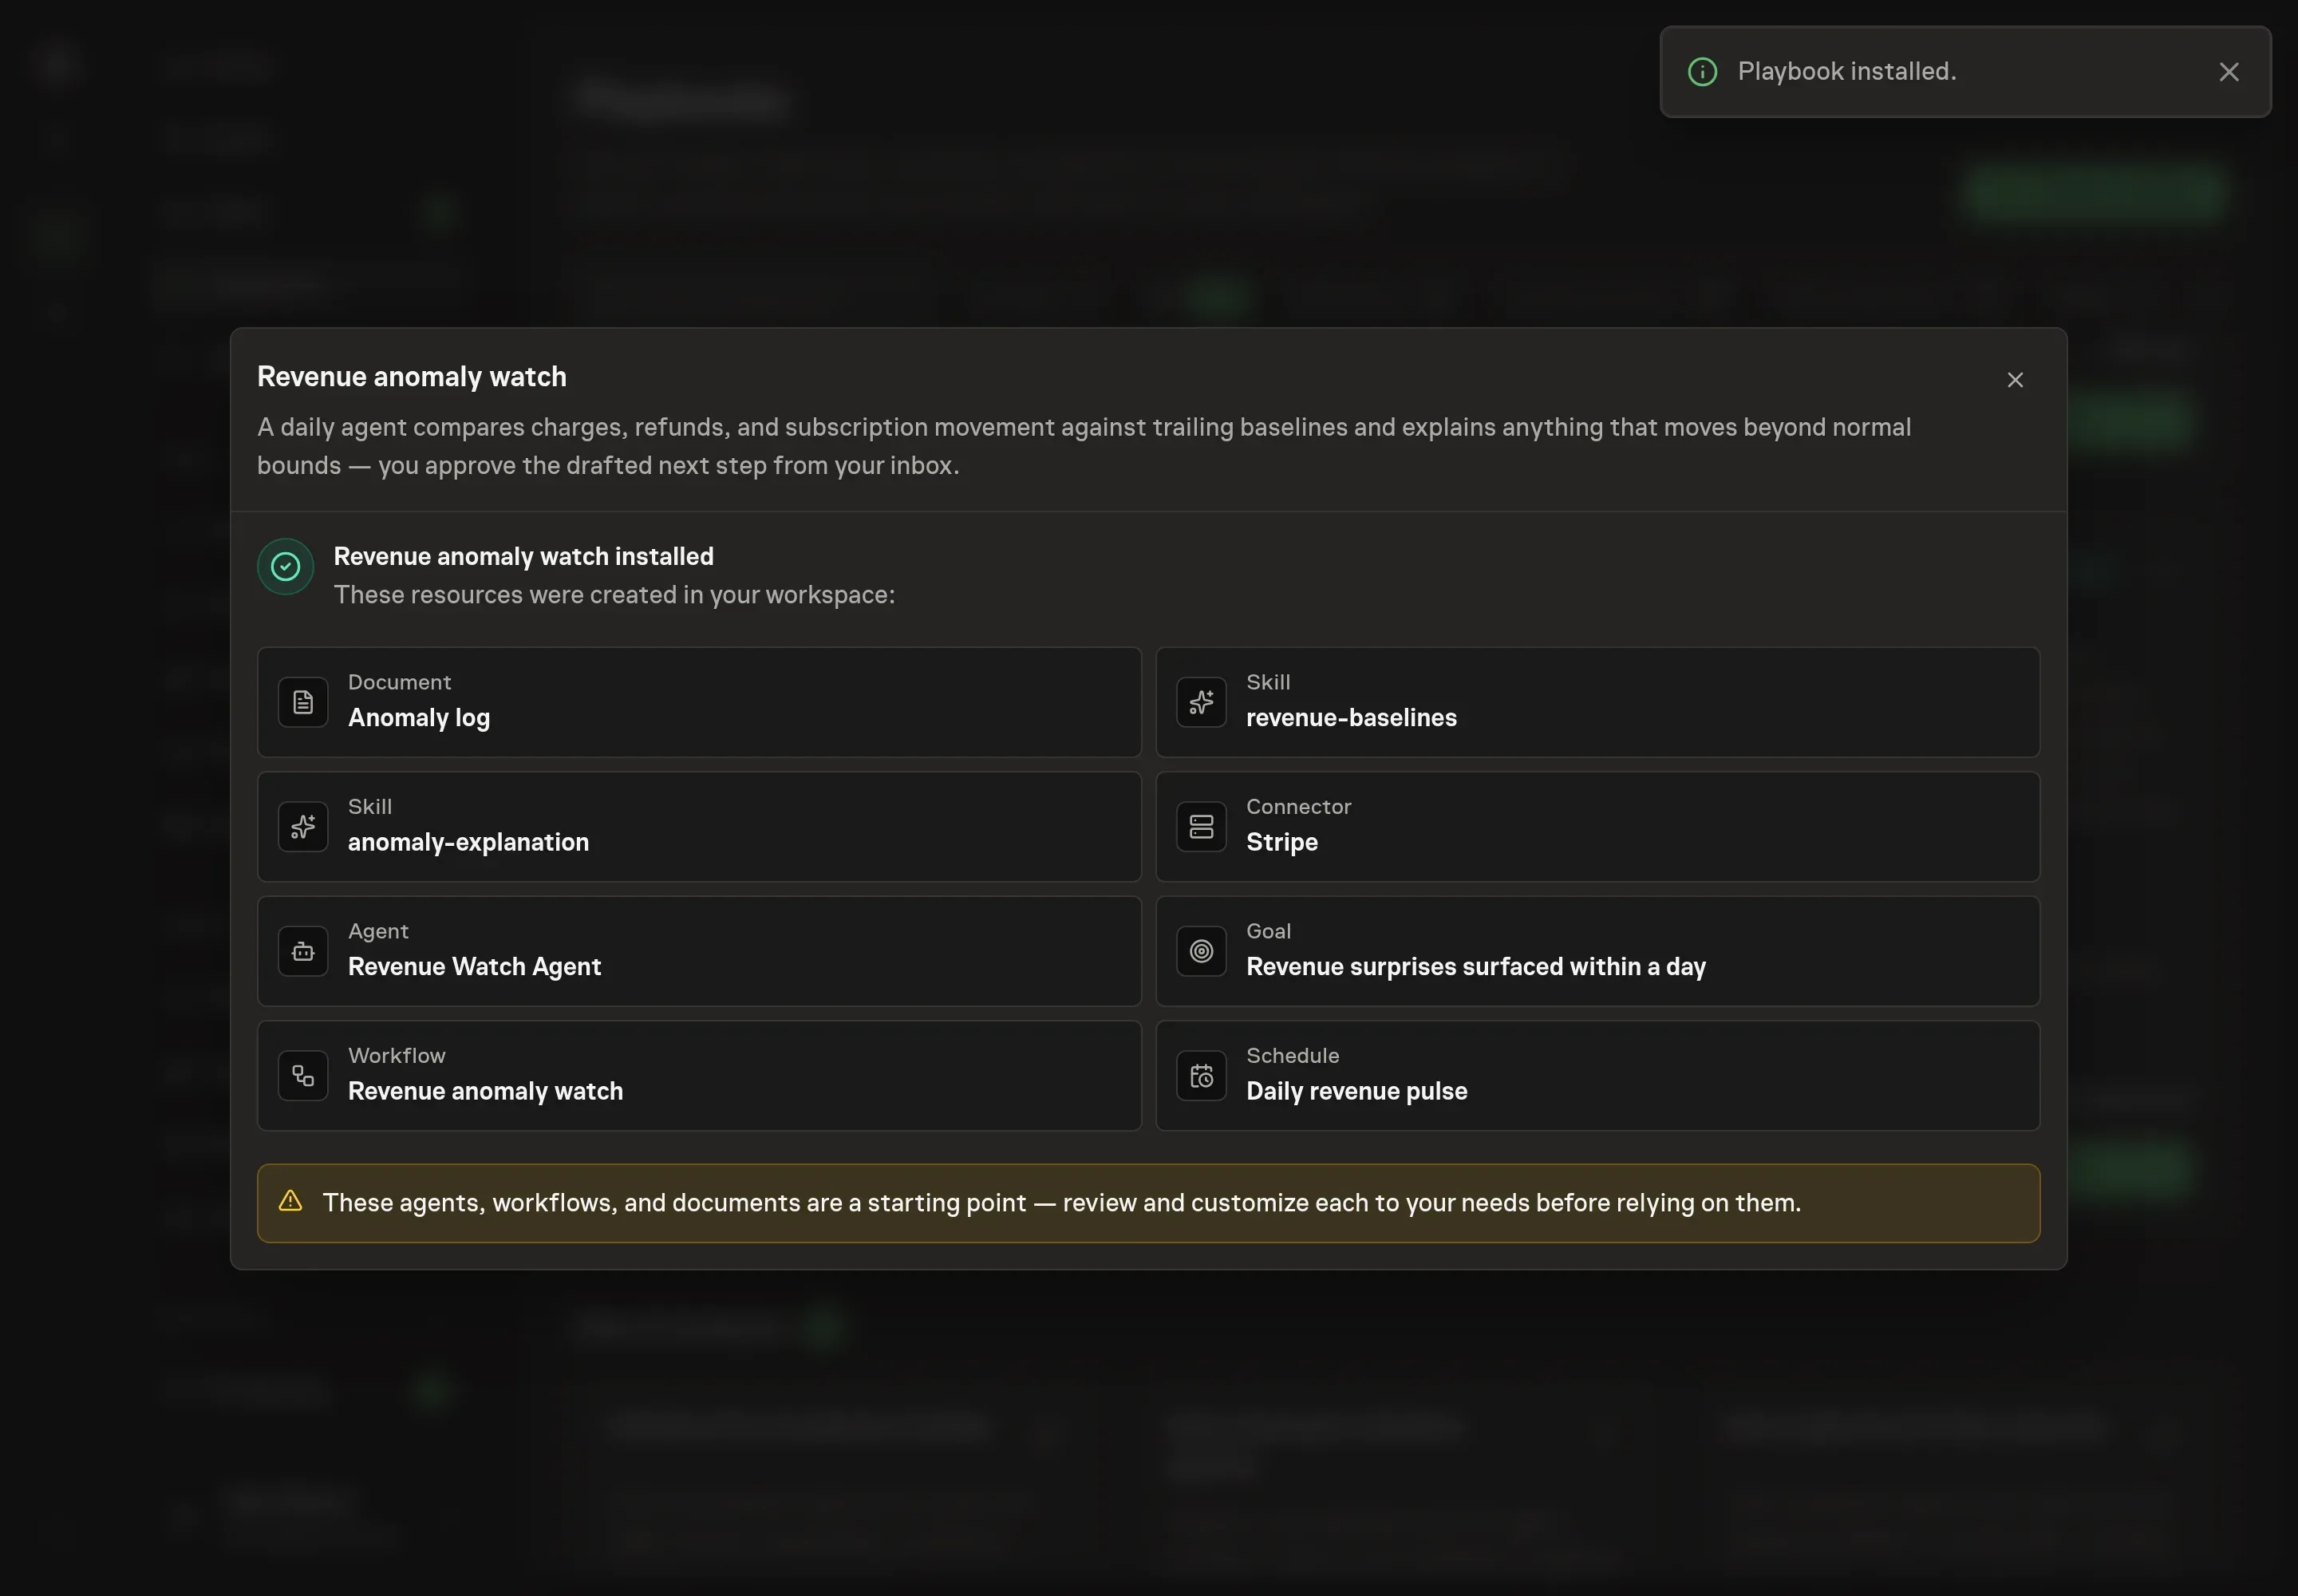
Choose Approve on the proposal in Chat when the configuration matches your brief. Task Machine installs that reviewed configuration. The approved item retains its review details. If your autonomy settings allow direct installation, this approval may not be required. Check the resulting configuration in that case too.
Complete any remaining secure service setup from the installation details in Chat. Inbox keeps those setup items available if you return later. Prepare the source documents and inputs before starting the first Task or Workflow. Installation does not authorize sending, publishing or changing an external service beyond the boundaries you agreed. Confirm each schedule's cadence and timezone, and resolve any pending schedule setup before it starts. A readback must wait for its agreed observation window and source data. Check the reviewed tracker or results document before the first cycle so evidence and human decisions have a durable home.
What good looks like
Most days should be short. A healthy watch produces one-line all-clears when metrics are in band and only opens anomalies when movement clears the configured bounds.
For flagged days, the briefing should show what moved, where it concentrated, the size versus baseline, a ranked cause with evidence, and one reversible next step. If the next step is not reversible, it probably needs more human review.
Common questions
What metrics should the watch include? Start with charge volume and count, refund volume and count, new subscriptions, churned subscriptions, and net MRR components when available.
Should every percentage move trigger an anomaly? No. Percentages on small counts are noisy. The playbook uses dollar floors, count rules, and same-weekday baselines to avoid false alarms.
Can the agent take action on an anomaly? No. It drafts one next step and routes it for sign-off.
What if a launch or price change is expected to move revenue? Add it to known upcoming events. The agent should suppress expected movement at roughly the expected size and only flag surprises beyond that.